Bulls Head for the Hills Once Again
After peaking at 32.8% two weeks ago, bullish sentiment continues to roll over as the S&P 500 has erased some of the March gains this week. After this week’s decline of 7.2 percentage points in bullish sentiment, less than a quarter of respondents reported as bullish. While low, that is still a few percentage points above the weaker levels from February.

Bearish sentiment in turn rose 13.9 percentage points which was the biggest one-week uptick since August 2019 when it rose 24.14 percentage points. At 41.4%, bearish sentiment is now at the highest level since the week of March 17th. That is an elevated reading and a big move week over week, but it is also well off recent highs from the past few months that were more than 10 percentage points higher.

The bull-bear spread tipped into positive territory for the first time in 2022 last week, but the big inverse moves between bulls and bears erased much of the past few weeks’ move. The spread is down to -16.7 which is still 13.6 points above the late February low of -30.3.

The big pickup in the number of respondents reporting as bearish didn’t entirely come from the bullish camp. Neutral sentiment also shed a significant amount falling from 40.6% last week to 33.9%. That is essentially mean reversion as neutral sentiment now sits only a couple of points above the historical average. Click here to view Bespoke’s premium membership options.

Treasuries Yields Blow Past Dividend Yields
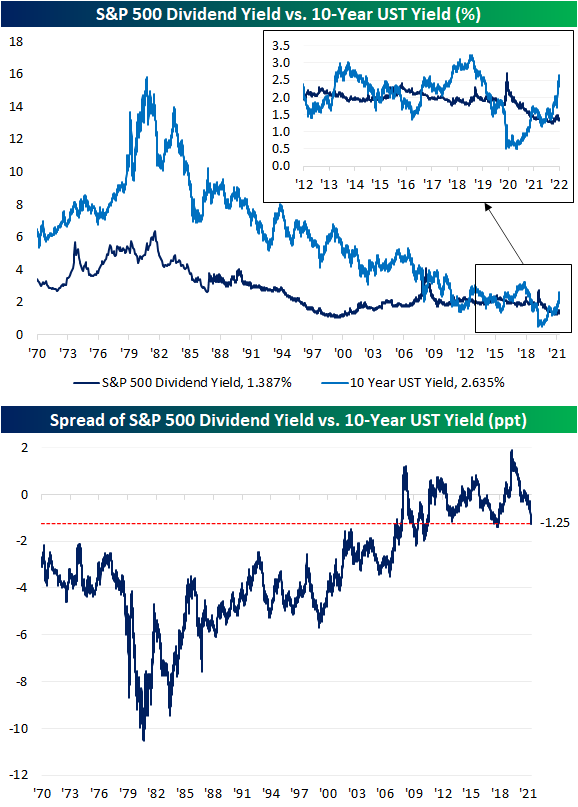
US Treasury yields have experienced a dramatic move higher as the market prices in continued rate hikes in the near future. With the increase in long-term Treasury yields, we’re starting to see what looks like the end of a period where the S&P 500 and the 10-year Treasury fought back and forth over which asset class had a more attractive yield.
As shown in the chart below, from 1970 right up to the period before the global financial crisis, the 10-year yield consistently yielded more than the S&P 500. As the Fed cut rates to zero during the crisis, though, the S&P 500 went on to see multiple periods where its dividend yield was in excess of the 10-year Treasury yield. With the recent surge in yields as the Fed embarks on what the market expects to be an aggressive rate hiking cycle, the script has been completely flipped. The 10-year now offers a roughly 125 bps higher yield than the S&P 500 dividend yield which is the widest spread since the fall of 2018 and before that, the fall of 2011. As the spread between the S&P 500 dividend yield and 10-year Treasury yield hits the low end of the GFC/post-GFC era, we would note that current levels are still roughly 200 bps higher than the historical average going back to 1970. Click here to view Bespoke’s premium membership options.
Near Record Low in Jobless Claims
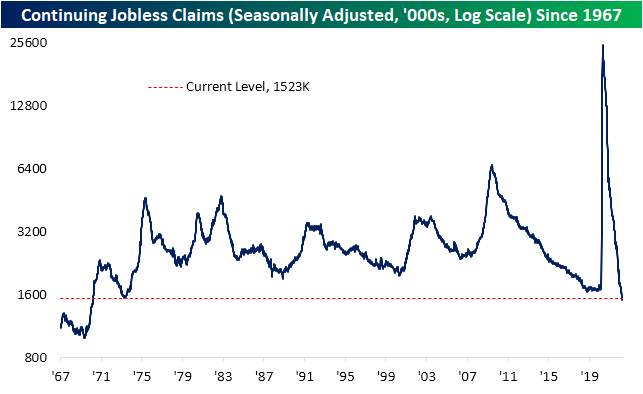
This week’s jobless claims release was significant in a couple of ways. For starters, the Department of Labor revised seasonal adjustment factors (more on that below) and second, the most recent print for the seasonally adjusted number hit one of the lowest levels on record. Claims came in at 166K which tied the number from two weeks ago (after revisions) for the second-lowest reading on record behind the week of 11/29/68. That week’s reading was only 4K lower.

As for continuing claims, this week’s reading was higher rising from 1.506 million to 1.523 million. Having come off last week’s low, that remains one of the strongest levels since 1970.
Pivoting back to initial claims, while adjusted claims are at multi-decade lows, non-seasonally adjusted claims are very healthy but not quite at a record. At current levels of 193.1K, the only year with a lower reading for the comparable week of the year was 1969 (170K) but at the seasonal lows in the few years prior to the pandemic, claims were even stronger than they are now. So while unadjusted claims are strong, the seasonally adjusted number was even more eyecatching this week.
As for why the seasonally adjusted number appears so much stronger, as shown in the second chart below, the current week of the year has historically been the second most consistent week of the year in seeing a week-over-week increase in claims. As a period with consistent seasonal headwinds, the seasonal adjustment would control for this by depressing the level of claims by a relatively strong seasonal factor. That usual increase was not seen this year as NSA claims were actually slightly lower falling from 196.8K to 193.1K. That means seasonal adjustment helped out what was already a strong number.
Additionally worth noting this week is the DOL changed its seasonal adjustment methodology. The DOL fully describes the change in this week’s release and links to further reading on the topic for those interested in going deeper into the weeds, but to briefly summarize: periods when the level of an economic indicator experiences historic shifts in levels as claims did in 2020 and 2021, multiplicative adjustment (which has been used in “normal times” like prior to the pandemic and from here forward) would tend to over or understate adjusted claims. Additive adjustment, on the other hand, is less affected by the actual level of the indicator meaning it would lead to more accurate approximations of seasonally adjusted numbers in times of sudden spikes in the series. This methodology has been used throughout the pandemic period. Now that claims have more or less returned to a more normal range of readings, the DOL sees it justifiable to switch the seasonal adjustment methodology back to multiplicative. While that does not mean too much for interpreting claims, that change in methodology has led to some large downward revisions. Click here to view Bespoke’s premium membership options.

The Closer – March Minutes Reaction, Balance Sheet Runoff, Neighbor Data, EIA – 4/6/22
Log-in here if you’re a member with access to the Closer.
Looking for deeper insight into markets? In tonight’s Closer sent to Bespoke Institutional clients, we begin with a summary of the minutes from the March FOMC meeting. We follow up with a note on balance sheet runoff and the market’s reaction to today’s release of the minutes. We then recap some data South and North of the border in the form of Mexican vehicle production and the record Ivey PMI in Canada. We close out with a recap of this week’s petroleum stockpile data from the EIA.
If you’re wondering what the Closer is like each day, click here or on the thumbnail image below for a sample of a few pages from the report.

See today’s full post-market Closer and everything else Bespoke publishes by starting a 14-day trial to Bespoke Institutional today!