The Overbought Buck
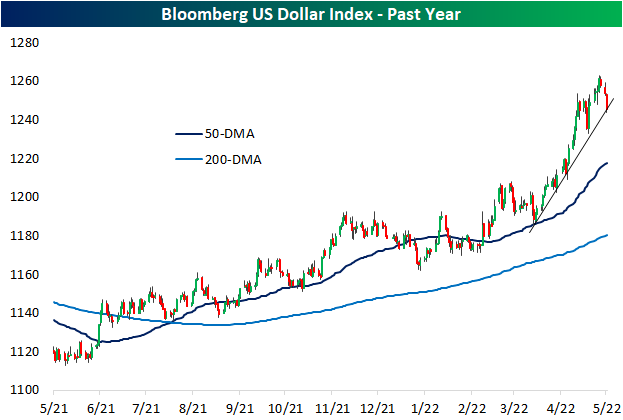
The US dollar has surged amidst the weakness in risk assets in 2022. While also part of a longer-term and more gradual uptrend over the past year, in the past couple of months the Bloomberg Dollar Index has seen its uptrend steepen significantly. Since the last retest of its 50-DMA at the end of March, the dollar was up over 6% through the closing high last Thursday. To round out last week and start this week, the dollar has pulled back sharply with a 1.25% decline. While that may not sound like much, it ranks in the third percentile of all 3-day moves going back to the start of the index in 2005.
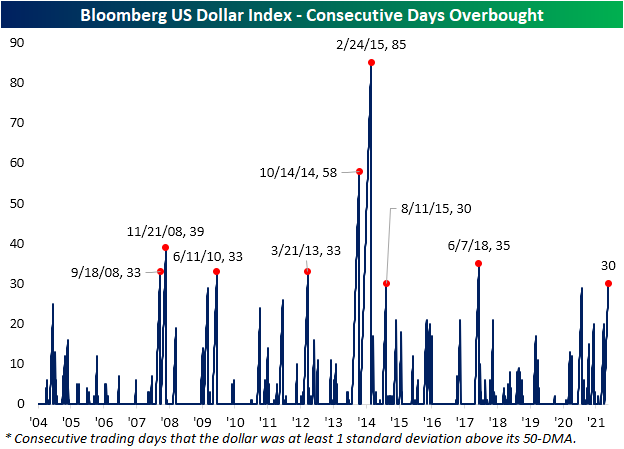
At the moment, the dollar is testing the aforementioned steep uptrend off the late March low. Assuming that the uptrend or any recent lows do not provide support, the dollar has much further to go until it would test its 50-DMA. In fact, the dollar would currently need to fall another 2.28% to reach its 50-DMA as it has consistently traded well above that moving average for multiple weeks in a row. As shown in the second chart below, the dollar recently hit some of the most overbought levels of the past five years, and the long stretch of days with overbought (1+ standard deviation above its 50-DMA) readings has continued.

While recent declines have put the streak on the ropes, today marks the 30th consecutive trading day that the dollar has been at least one standard deviation above its 50-DMA. Going back through the history of the index, there have only been 8 other streaks that have also gone on for at least 30 trading days. The most extended of these ended in February 2015 at 85 days long. The next longest only occurred shortly before that in October 2014.
Additionally, given the dollar has been pulling back, it could be reasoned that stocks with heavy domestic exposure would underperform relative to those with more international exposure. Since last Thursday, that has largely been the case. In the chart below, we have broken down the Russell 1,000 into deciles based on their share of revenues generated from abroad. The first decile is composed entirely of stocks with 100% of revenues generated within the US while the tenth decile is the stocks with the most international exposure. That tenth decile has seen notable outperformance with an average gain of nearly 6% versus an average of 4.2% for all other deciles. The eighth and ninth deciles have also averaged stronger returns than most other groups while the worst performance comes from the first decile, the 100% domestic stocks. Click here to learn more about Bespoke’s premium stock market research service.

Homebuilders Sentiment Free Fall
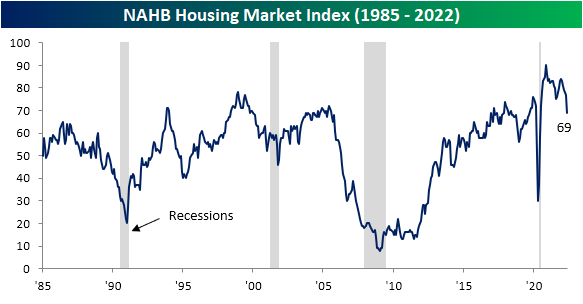
Although material cost pressures have shown some signs of alleviating (for example lumber and copper futures have been grinding lower), the cost to finance a home has only increased with the national average of a 30-year fixed-rate mortgage hovering around 5.5%. That higher cost dampens demand, and homebuilder sentiment has taken a sharp turn lower. The NAHB’s Housing Market Index fell from a top 5% reading of 77 last month all the way down to a new 52-week low of 69 this month. The index has been rolling over for some time now after peaking all the way back in November 2020, and the 8 point month over month decline in May is the worst of that span, ranking as the fourth largest monthly decline in the history of the index. Two of those larger declines came in the midst of recessions/major economic shocks—October 2001 (9/11) and April 2020 (start of the pandemic). The other largest drop was in February 2014.
The big drop in the headline index points to a notable deterioration in reported conditions and similar drops were shared across the sub-indices. Present sales remain the most elevated with its reading of 78 managing to stay in the top decile of its historical range, but just barely so as the 8-point m/m decline also ranks as one of the largest on record. Even though reported sales are holding up decently (albeit far from improving), sentiment for future sales has collapsed. After a double-digit decline this month, the index is below its historical median meaning homebuilders are anticipating activity to slowdown in the coming months. One likely reason is that overall traffic has pulled back sharply. The 9-point month-over-month drop is tied for the second-largest decline on record.

From a geographic standpoint, this month was interesting. As with the national indices, the Midwest and West saw some of the sharpest activity pullbacks in the history of the survey. Those indices are now around similar levels to the spring of 2020. For the South, the decline did not result in an outright collapse below the post-pandemic range, but nonetheless, the decline was enormous by historic standards.
Then there’s the Northeast. While the rest of the country experienced sharp pullbacks, the Northeast index actually rose by 2 points to 76. Although the level remains middling versus its post-pandemic range, it is a notable divergence compared to the rest of the country.

In spite of the report on homebuilder sentiment, homebuilder stocks, as proxied by the iShares US Home Construction ETF (ITB), are actually higher alongside the rest of the market, currently up 1.3%. Those gains on top of the past few days’ rally appear more technical in nature than any sort of improvement in the overall backdrop for the space. As shown below, the group has been hit hard this year as mortgage rates have soared. Hardly at any point this year has the group managed to trade above its moving averages. Click here to learn more about Bespoke’s premium stock market research service.

The Closer – Merger Madness, Empire Fed vs. Stocks, Credit Card Defaults – 5/16/22
Log-in here if you’re a member with access to the Closer.
Looking for deeper insight into markets? In tonight’s Closer sent to Bespoke Institutional clients, we begin tonight with a rundown of recent merger and acquisition news and the overall slowdown of activity (page 1). Next, we note the relationship between the Empire Fed survey and stock prices (page 2) followed by a recap of today’s Treasury International Capital flow data (page 3). We then look at credit card defaults and wheat exports (page 4) followed by a preview of this week’s Treasury auctions (page 5). We finish with a look at last week’s Commitments of Traders data (pages 6 through 8).

See today’s full post-market Closer and everything else Bespoke publishes by starting a 14-day trial to Bespoke Institutional today!