Jun 3, 2022
Bespoke’s Crypto Report contains numerous technical, momentum, and sentiment charts for bitcoin, ethereum, and other key cryptos. Page 1 of the report includes our weekly commentary on the space and attempts to identify any new trends that are emerging. The remaining pages include important overbought/oversold levels to watch, charts on historical drawdowns and rallies, seasonality trends, futures positioning data, Google search trend shifts, and more. Our weekly Crypto Report is produced so that followers of the space can more easily stay on top of price action, technicals, seasonality, and sentiment.
Sign up for a monthly or annual subscription to Bespoke Crypto to receive our weekly Crypto Report and anything else we publish related to cryptos. Note: If you’re currently a Bespoke Premium, Bespoke Newsletter, or Bespoke Institutional subscriber, you’ll need to subscribe to Bespoke Crypto as an add-on to receive access. The weekly Crypto Report and any additional crypto analysis is not included with our Premium, Newsletter, or Institutional memberships. You can sign up for Bespoke Crypto and receive our Crypto Report in your inbox weekly using the monthly or annual checkout links below. If you sign up for the annual plan, the first year of access is 50% off!
Bespoke Crypto Access — Monthly Payment Plan ($49/mth)
Bespoke Crypto Access — Annual Payment Plan ($247.50 for the first 12 months, then $495/year in year 2 and beyond)

Bespoke Investment Group, LLC believes all information contained in this service to be accurate, but we do not guarantee its accuracy. None of the information in this service or any opinions expressed constitutes a solicitation of the purchase or sale of any securities, commodities, or cryptocurrencies. This service contains no buy or sell recommendations. This is not personalized advice. Investors should do their own research and/or work with an investment professional when making portfolio decisions. As always, past performance of any investment is not a guarantee of future results. Bespoke representatives or clients may have positions in securities discussed or mentioned in its published content.
Jun 2, 2022
Log-in here if you’re a member with access to the Closer.
Looking for deeper insight into markets? In tonight’s Closer sent to Bespoke Institutional clients, we begin tonight with a look at the day’s Fedspeak and major earnings reports (page 1) before showing a decile analysis of recent performance for the Russell 3,000 (page 2). Turning to macro data, we then provide an update on factory orders, sales, and inventories (page 3). We then delve into today’s petroleum inventory data from the EIA (page 4) followed by a look at the historic one day move in copper prices (page 5).

See today’s full post-market Closer and everything else Bespoke publishes by starting a 14-day trial to Bespoke Institutional today!
Jun 2, 2022
It was a mixed morning for labor market data. What could be a bad omen for tomorrow’s Nonfarm Payrolls number, ADP’s monthly payroll report showed the weakest month of job creation since the start of the pandemic. On the bright side, this week’s initial jobless claims number continued to reverse off of recent highs dropping back down to 200K. While the levels from February through April were even stronger, this week’s reading remains impressive nonetheless with the only comparable levels being during the two years leading up to the pandemic as well as all the way back in the late 1960s.
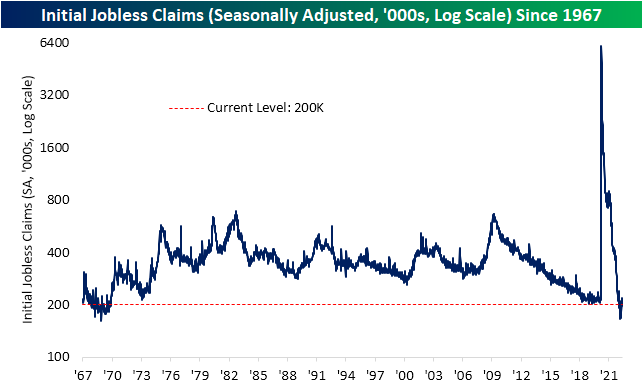
From a seasonal perspective, tailwinds are likely to become headwinds over the next couple of months. As shown in the second chart below, the current week of the year has historically been when unadjusted jobless claims have put in a seasonal low. That is typically followed by several weeks of consistent weekly increases that lead to a short-term peak usually in mid-July. In other words, it should not be surprising to see claims move higher in the weeks ahead, but regardless of any seasonal moves, this week did mark the lowest reading for the comparable week of the year since 1973. That reaffirms the seasonally adjusted reading in that claims are at impressively low levels.

Although initial claims have come off the lows and are likely to keep doing so as seasonal trends shift, continuing claims keep hitting new lows. This week’s reading fell all the way down to 1.309 million from 1.343 million last week. That is now the lowest level since the last week of 1969. Click here to learn more about Bespoke’s premium stock market research service.

Jun 2, 2022
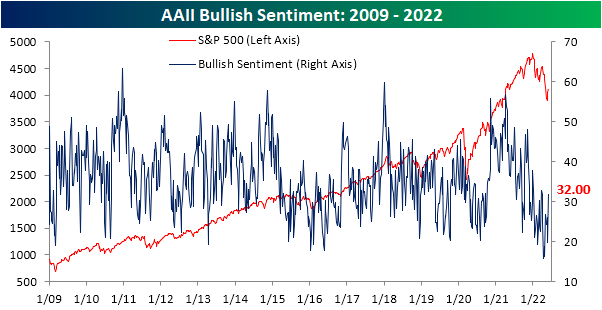
Sentiment has taken a big swing higher across surveys this week as the S&P 500 has experienced some upside mean reversion. The weekly AAII sentiment survey has seen bullish sentiment rebound from a sub-20% reading all the way back up to 32%. Relative to the historical average of 37.84%, that reading continues to show a depressed level of optimism for individual investors, but it is the strongest reading since the week of March 24th. As for the 12.2 percentage point jump in bullish sentiment week over week, it was the largest one week gain since the week of October 14th of last year when it rose 12.4 percentage points.
As bullish sentiment surged, there was a massive 16.4 percentage point drop in bearish sentiment. That was the largest one week decline in the reading on pessimism since July 15, 2010 when it fell 19.27 percentage points. Now at 37.1%, bearish sentiment is at the lowest level since the end of March.
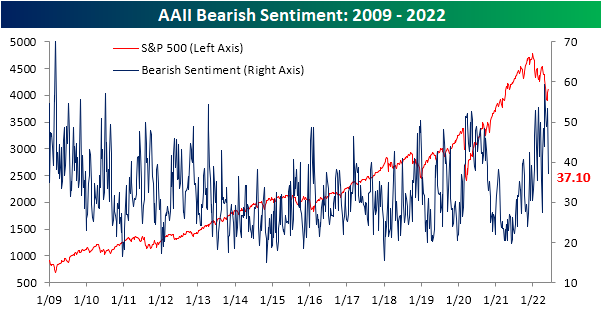
Such a large decline in bearish sentiment in only one week has pretty much been unheard of in the post Financial Crisis years. Again, July 2010 was the last time bears fell by at least 15 percentage points and before that there are only about two dozen other occurrences without another instance in the previous three months. While it was a big decline, bearish sentiment remains fairly elevated at 37.1%, but that is inline with most other occurrences since the mid 2000s whereas bearish sentiment was generally lower from the occurrences before 2005.
As for how the S&P 500 has tended to do following these massive bearish sentiment shifts, the S&P 500 has generally tended to move higher with outperformance versus the norm on a median basis one week and one month out. Although again performance is consistently positive, the size of gains have tended to be below or more inline with the norm three, six, and twelve months out from these occurrences.

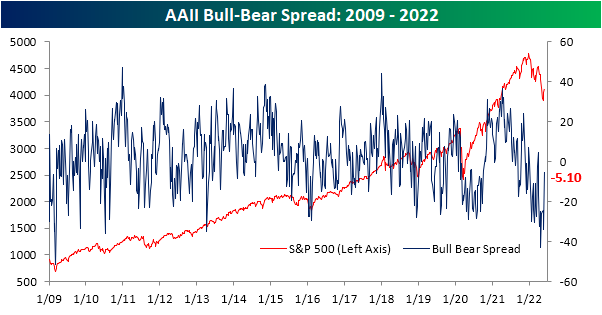
After the large moves in bulls and bears this week, sentiment continues to favor pessimism but to a much smaller degree than recent weeks as the bull bear spread narrowed to -5.1 points. Click here to learn more about Bespoke’s premium stock market research service.