Claims Resume Their Trend Higher
Initial jobless claims were expected to tick higher this week with forecasts calling for a rise to 235K. Instead, the increase was even more pronounced moving up to 239K from last week’s unrevised reading of 228K. As we detailed last Thursday, the revisions to claims have resulted in a total shift in this indicator of the labor market. After seasonal adjustment, claims are now definitively trending higher since the September low.

Before seasonal adjustment, claims were likewise higher week over week as could be expected given seasonal tendencies. As shown below, the current week of the year has often seen claims rise. In fact, historically unadjusted claims have risen 85.7% of the time during the current week of the year. That is tied with three others (the weeks of approximately January 8th, October 1st, and November 5th) for the week of the year to most consistently see claims increase week over week. Given that increase, levels this year are similar to those of the several years prior to the pandemic meaning that claims remain healthy before seasonal adjustment.

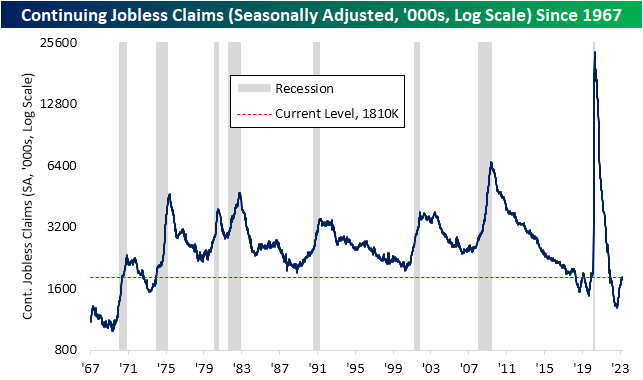
Whereas initial claims came in higher than expected, continuing claims actually were healthier. Instead of the 10K increase penciled in by forecasters, continuing claims fell by 13K to 1.823 million. Although in the short term that is a stronger-than-expected reading, continuing claims remain in an uptrend since the fall and are now at the high end of the range of readings that were common in the two years leading up to the pandemic.
Have you tried Bespoke All Access yet?
Bespoke’s All Access research package is quick-hitting, actionable, and easily digestible. Bespoke’s unique data points and analysis help investors better visualize underlying market trends to ultimately make more informed investment decisions.
Our daily research consists of a pre-market note, a post-market note, and our Chart of the Day. These three daily reports are supplemented with additional research pieces covering ETFs and asset allocation trends, global macro analysis, earnings and conference call analysis, market breadth and internals, economic indicator databases, growth and dividend income stock baskets, and unique interactive trading tools.
Click here to sign up for a one-month trial to Bespoke All Access, or you can read even more about Bespoke All Access here.


