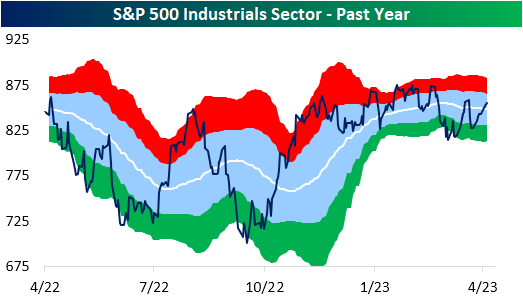
Sector Breadth All Over the Place
In terms of price, the Industrials sector remains 5.75% below its high from January of last year and has yet to even take out the highs from earlier this year, but breadth has been more constructive recently. Just yesterday, the sector’s cumulative advance/decline line—the cumulative sum of the sector’s daily difference in the number of advancing and declining stocks—hit a new all time high.

Although that measure of breadth is making promising moves, other breadth measures have not exactly echoed that strength. In spite of the record high in the cumulative A/D line Monday, only 37% of the sector’s stocks finished above their 50-DMAs. As shown below, of all other instances of a record high in the cumulative AD line, there has never been such a low reading in the percentage of stocks above their 50-DMAs. In fact, no other readings have even crossed into the 30% range! For the vast majority of previous highs, the percentage of stocks above their 50-DMAs has sat at 70% or more.

All that is to say that most Industrials sector stocks are moving higher, but have not yet moved above potential resistance at their 50-DMAs. And even though the reading on the percentage of stocks above their 50-DMAs is low at the moment, that is not to say it is not improving rapidly. As shown below, it has risen sharply from the low of 19.18% on April 6th. Furthermore, whereas Monday’s close only saw 37% of the sector finish above their 50-DMAs, as of mid-morning Tuesday, the reading is already up another 8.2 percentage points to 45.2% as the average stock in the sector trades just 7 bps below its 50-DMA.

Have you tried Bespoke All Access yet?
Bespoke’s All Access research package is quick-hitting, actionable, and easily digestible. Bespoke’s unique data points and analysis help investors better visualize underlying market trends to ultimately make more informed investment decisions.
Our daily research consists of a pre-market note, a post-market note, and our Chart of the Day. These three daily reports are supplemented with additional research pieces covering ETFs and asset allocation trends, global macro analysis, earnings and conference call analysis, market breadth and internals, economic indicator databases, growth and dividend income stock baskets, and unique interactive trading tools.
Click here to sign up for a one-month trial to Bespoke All Access, or you can read even more about Bespoke All Access here.

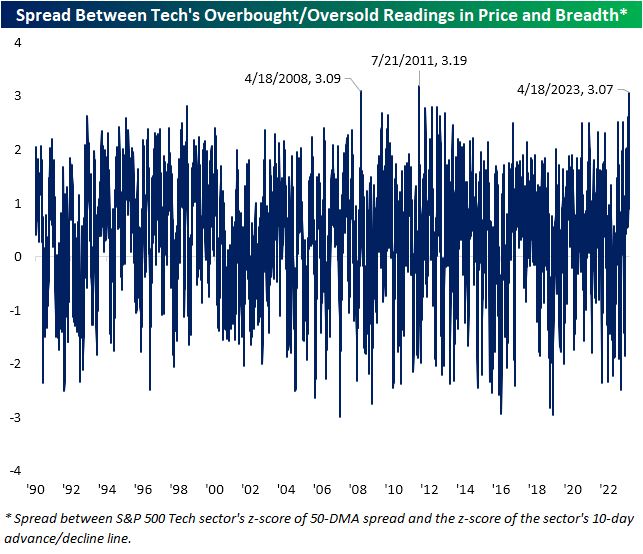
Historic Divergence in Tech Price and Breadth
Each day in our Sector Snapshot, we highlight the overbought and oversold readings of each S&P 500 sector based on price and breadth. For price, we consider a sector to be overbought when it trades at least one standard deviation above its 50-DMA and oversold when it is one standard deviation below its 50-DMA. For breadth, we look at the 10-day advance-decline line. Again, when the 10-day A/D line rises at least one standard deviation above its historical average, it can be considered overbought and vice versa.
The Tech sector is in an unusual place in which price has been overbought for the entirety of the past month while short-term breadth has dropped into oversold territory in the past two sessions.

Taking a spread of the two measures, that is nearly a record divergence. As shown below, there have only been two other times in which there has been a three-standard deviation difference between the overbought/oversold levels of price and breadth. The most recent of these was in July 2011 when similar to now, the sector traded over 1.4 standard deviations above its 50-DMA while the 10-day A/D line was over a standard deviation below its historical average. The other instance was exactly 15 years ago in April 2008. That time was slightly different in that price was extremely overbought trading 3 standard deviations above its 50-DMA while breath was neutral and only slightly negative.
Given the Tech sector has managed to perform well on unimpressive breadth, it would imply mega caps are buoying the market cap-weighted index.
Have you tried Bespoke All Access yet?
Bespoke’s All Access research package is quick-hitting, actionable, and easily digestible. Bespoke’s unique data points and analysis help investors better visualize underlying market trends to ultimately make more informed investment decisions.
Our daily research consists of a pre-market note, a post-market note, and our Chart of the Day. These three daily reports are supplemented with additional research pieces covering ETFs and asset allocation trends, global macro analysis, earnings and conference call analysis, market breadth and internals, economic indicator databases, growth and dividend income stock baskets, and unique interactive trading tools.
Click here to sign up for a one-month trial to Bespoke All Access, or you can read even more about Bespoke All Access here.
Chart of the Day: Six Months Without a New Low
This content is for members onlyThe Closer – Trucking Slowdown, Deposit Flight, Foreign Buyers, CoT – 4/17/23
Log-in here if you’re a member with access to the Closer.
Looking for deeper insight into markets? In tonight’s Closer sent to Bespoke Institutional clients,In tonight’s Closer, we begin with some commentary regarding the debt ceiling and trucking earnings (page 1). We then dive into the details of Schwab’s earnings and bank deposits (page 2). Turning to macro data, we recap today’s Empire Fed report (page 3), TICS report (page 4), auction preview (page 5), and positioning data (pages 6-8).

See today’s full post-market Closer and everything else Bespoke publishes by starting a 14-day trial to Bespoke Institutional today!