S&P 500 Futures Historically Shorted

As we do each Monday, in last night’s Closer we highlighted the latest futures positioning data from last Friday’s release of the CFTC’s Commitments of Traders report.  Of all assets, perhaps the most striking number was in S&P 500 futures. In data as of last Tuesday, a net 15.11% of open interest among speculators was positioned short. That marked the most bearish positioning for this class of investors since September 2007.  Prior to that, there have been relatively few instances of speculator positioning exceeding 15% net short.  Most of those occurred in the late 1990s and early 2000s when positioning readings were far more volatile on account of open interest being much smaller than it is today.  With that being said, we would also note that open interest has been trending lower in the past few years with recent readings being some of the lowest since 2008 on a 52-week moving average basis.

Make sure to check out tonight’s Closer, where we provide an analysis of the performance of the S&P 500 following other historically net short readings.

Have you tried Bespoke All Access yet?

Bespoke’s All Access research package is quick-hitting, actionable, and easily digestible. Bespoke’s unique data points and analysis help investors better visualize underlying market trends to ultimately make more informed investment decisions.

Our daily research consists of a pre-market note, a post-market note, and our Chart of the Day. These three daily reports are supplemented with additional research pieces covering ETFs and asset allocation trends, global macro analysis, earnings and conference call analysis, market breadth and internals, economic indicator databases, growth and dividend income stock baskets, and unique interactive trading tools.

Click here to sign up for a one-month trial to Bespoke All Access, or you can read even more about Bespoke All Access here.

Fed Days Flipping Script

The FOMC blackout period is now underway meaning there will be no communications from FOMC members until the day of the May meeting. As we detailed yesterday, performance outside of and during blackout periods has been pretty weak during the current roughly year-long tightening cycle. However, things have been improving more recently. As for Fed days themselves, the opposite has been true.

In the chart below, we show the performance of the S&P 500 on the day of FOMC rate decisions going back to 1994.  Earlier in the current tightening cycle, Fed days offered the market a brief respite from selling. In fact, some of the strongest Fed days (in terms of S&P 500 performance) of the past few decades occurred last year as the rolling 10-meeting average hit a more than decade-long high in July.  With that being said, that average has been rolling over with weaker reactions to the FOMC in the past few meetings. In other words, to some extent, S&P 500 performance during and outside of blackout periods and on Fed days has begun to flip the script in the past few FOMC meetings.

Have you tried Bespoke All Access yet?

Bespoke’s All Access research package is quick-hitting, actionable, and easily digestible. Bespoke’s unique data points and analysis help investors better visualize underlying market trends to ultimately make more informed investment decisions.

Our daily research consists of a pre-market note, a post-market note, and our Chart of the Day. These three daily reports are supplemented with additional research pieces covering ETFs and asset allocation trends, global macro analysis, earnings and conference call analysis, market breadth and internals, economic indicator databases, growth and dividend income stock baskets, and unique interactive trading tools.

Click here to sign up for a one-month trial to Bespoke All Access, or you can read even more about Bespoke All Access here.

The Closer – Last Republic, Broken Bills, Dallas Whif – 4/24/23

Log-in here if you’re a member with access to the Closer.

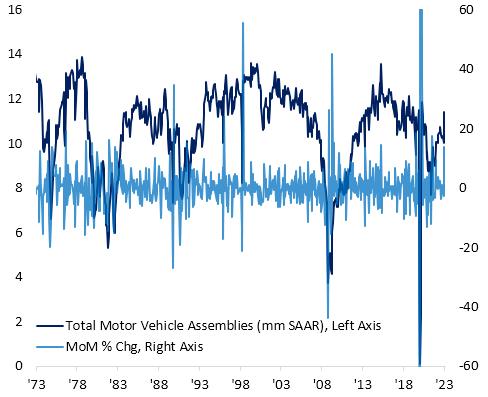
Looking for deeper insight into markets? In tonight’s Closer sent to Bespoke Institutional clients, we begin with a look at First Republic (FRC) and other notable earnings (page 1) followed by a dive into the monster bid for bills maturing prior to debt ceilings (page 2). We also take a look at the Overnight Reverse Repurchase facility and bill issuance (page 3).  We then switch over to an update of our Five Fed Composite (page 4), preview this week’s upcoming Treasury auctions (page 5), and the fresh low in S&P 500 positioning (pages 6-8).

See today’s full post-market Closer and everything else Bespoke publishes by starting a 14-day trial to Bespoke Institutional today!

Fed Blackout Begins

Saturday began the FOMC’s blackout period meaning there will be no communication from Fed officials for the next several days until the May 3rd meeting (Hooray).  As of Monday afternoon, the CME’s FedWatch Tool is pricing in a nearly 90% chance of a 25 bps hike at that meeting.

In the chart below, we show the performance of the S&P 500 from the end of a Fed day until the start of the blackout period for each inter-meeting period since 1994 when the FOMC began announcing its rate decisions on the same day as the meetings.  Since the current tightening cycle began a little over a year ago, most periods between meetings and blackouts have seen the S&P 500 turn lower with a median decline of 0.53%.  One notable exception to that weakness was after the meeting last November when the S&P 500 went on to rally over 8% leading up to the blackout period.  That was the strongest run for the S&P 500 from meeting to blackout since June 2009. As for more recently, the 5% gain from the March meeting through last Friday again stands out ranking as the second strongest of the current tightening cycle (out of ten).

In the chart below, we show the performance from the start of each past blackout period up through the last close prior to the FOMC meeting.  Again, the current tightening cycle has tended toward weak performance for the S&P 500 with more declines than gains.  However, the last blackout period in March saw the strongest gain for the S&P 500 since the runup to the June 2020 meeting.

Although there has been some strength during and leading up to blackout periods more recently (especially relative to earlier this tightening cycle), over the full history of the data, strong performance ahead of the blackout period is not a good explainer of performance during the blackout period itself. As shown below, there has historically been a wide dispersion of results without much in the way of a trend. In other words, the strong performance headed into the blackout period in and of itself does not mean it will continue as Fed speakers go quiet.

Have you tried Bespoke All Access yet?

Bespoke’s All Access research package is quick-hitting, actionable, and easily digestible. Bespoke’s unique data points and analysis help investors better visualize underlying market trends to ultimately make more informed investment decisions.

Our daily research consists of a pre-market note, a post-market note, and our Chart of the Day. These three daily reports are supplemented with additional research pieces covering ETFs and asset allocation trends, global macro analysis, earnings and conference call analysis, market breadth and internals, economic indicator databases, growth and dividend income stock baskets, and unique interactive trading tools.

Click here to sign up for a one-month trial to Bespoke All Access, or you can read even more about Bespoke All Access here.