Nov 30, 2023
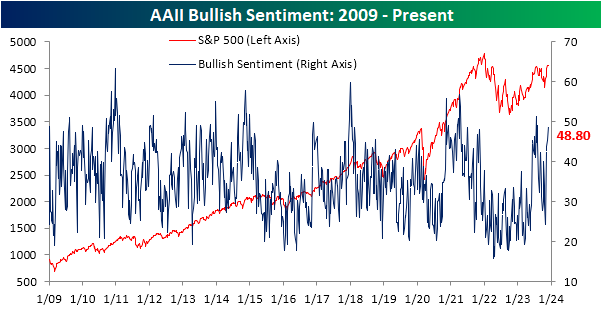
November was a remarkable month for stocks, though equities have stalled out just below prior lows. That has not thwarted investor sentiment though. The latest sentiment survey from the AAII showed 48.8% of investors reported as bullish, up from 45.3% last week. That is now the highest reading on bullish sentiment since the first days of August, and is more than 10 percentage points above the historical average of 37.5%.
While bullish sentiment has not yet moved above its prior highs, the share of respondents reporting as bearish has set a new low. The reading has experienced a dramatic shift having started November above 50%, and fallen all the way down to 19.6% this week. That is the lowest level of bearish sentiment since the first week of 2018!

Perhaps even more impressive is that over 30 percentage point drop in the past four weeks ranks as one of the largest declines on record. Since the start of the survey in 1987, the current four week decline ranks as the fourth largest on record. The last occurrence was all the way back in April 2009.

As a result of the massive drop in bears, the bull-bear spread has risen to 29.2, just shy of the July high of 29.9.

The AAII survey was not alone in having seen a surge in optimism. For example, the Investors Intelligence survey likewise is seeing the strongest bullish sentiment since early August and the NAAIM Exposure Index is at the highest level since late July. Combining these readings into our sentiment composite shows the index is now at 0.95 indicating the average sentiment survey is now almost a full standard deviation above (meaning more bullish than) its historical average.


Nov 30, 2023
Initial jobless claims experienced a 22K drop last week (after a 2K upward revision this week), the largest one week decline since June 24th. Claims experienced a modest rebound in the most recent print rising back to 218K. At that level, claims are in the middle of the past couple of year’s range which is also historically healthy relative to pre-pandemic readings.

Before seasonal adjustment, claims experienced an unusually large drop back below 200K. That is the first sub-200K print since the end of October. Additionally, it is a record low relative to the comparable week of the year throughout history. While that may sound like a positive, we’d be hesitant to begin shooting off confetti. That drop and low reading are more likely a function of the Thanksgiving holiday, and as shown below, this week’s drop is only a dent to the seasonal rise in claims that is typical for this time of year. In other words, one week does not make a trend.

While the initial claims number is likely not trending in a more positive direction, the concerning climb in continuing claims has pressed on. Seasonally adjusted continuing claims have continued their rapid rise with a week-over-week increase in nine of the last ten weeks. That has resulted in a fresh two-year high of 1.927 million.

Nov 29, 2023
Log-in here if you’re a member with access to the Closer.
Looking for deeper insight into markets? In tonight’s Closer sent to Bespoke Institutional clients, we begin with some commentary on the additional dovish Fed commentary we received today (page 1) followed by a dive into the latest GDP figures (page 2). Next, we update our Beige Book Index (page 3) in addition to bank balance sheet data (pages 3 and 4).

See today’s full post-market Closer and everything else Bespoke publishes by starting a 14-day trial to Bespoke Institutional today!