Feb 4, 2025
Log-in here if you’re a member with access to the Closer.
Looking for deeper insight into markets? In tonight’s Closer sent to Bespoke Institutional clients, we start out with a look into the massive recovery in cruise stocks (page 1). We then look at the latest job openings data through Indeed (page 2) and JOLTS data sets (page 3). Next, we review the latest Fedspeak and earnings (page 4) before switching over to a look at housing inventories (pages 5 and 6) and delinquency data (page 7).

See today’s full post-market Closer and everything else Bespoke publishes by starting a 14-day trial to Bespoke Institutional today!
Feb 3, 2025
Log-in here if you’re a member with access to the Closer.
Looking for deeper insight into markets? In tonight’s Closer sent to Bespoke Institutional clients, we begin with a look at the S&P 500’s impressive intraday reversal and country ETF performance (page 1). We then look at the latest construction spending data (page 2) and the snapped streak of contractionary readings for the ISM manufacturing index (page 3). We finish with a weekly rundown of positioning data (pages 4 – 7).

See today’s full post-market Closer and everything else Bespoke publishes by starting a 14-day trial to Bespoke Institutional today!
Feb 3, 2025
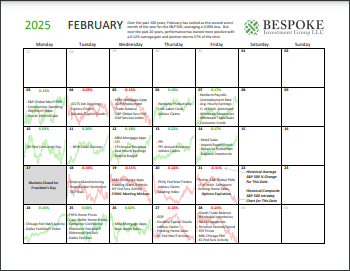
Please click the image below to view our February 2025 market calendar. This calendar includes the S&P 500’s historical average percentage change and average intraday chart pattern for each trading day during the upcoming month. It also includes market holidays and options expiration dates plus the dates of key economic indicator releases. Click here to view Bespoke’s premium membership options.