Mar 3, 2025
Entering the final month of the first quarter, most S&P 500 sectors are sitting on year-to-date gains, although there are two notable exceptions. The Tech sector is currently down 5.29%, which has dragged on broader market performance, given it’s by far the largest sector by market cap. Consumer Discretionary is down an even worse 5.65% year to date, and returns look even worse when compared to the December 17th high. Since then, the sector is down just under 12%. As shown below, using the sector ETF (XLY) as a proxy for the group, that latest correction leaves it in no-man’s-land between the 50 and 200-day moving averages with the recent low finding some support around the November post-election low.

Taking a look under the hood, breadth since that December high hasn’t been that bad. Of the 50 stocks in the sector, half are higher, and half are lower since the high. However, there is a far larger weight in the losers than the winners. Among the decliners are the sector’s largest names: Tesla (TSLA) and Amazon (AMZN). Given that the S&P 500 is weighted by market cap, those declines in the mega caps—namely the outsized 38.4% drop in TSLA shares—have acted as significant drags on broader index performance.
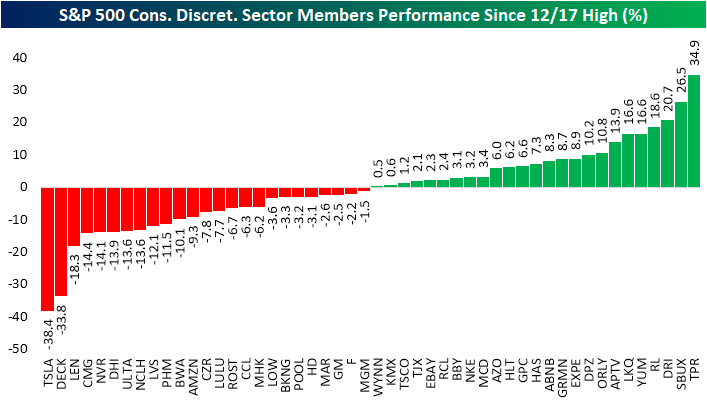
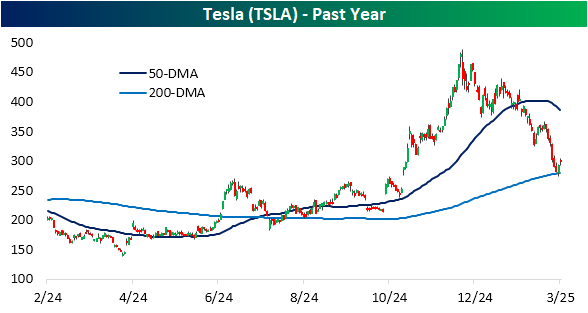
Zeroing in on Tesla (TSLA), the stock peaked a day after the Consumer Discretionary sector, closing at a 52-week high on December 18. Regardless, it’s been a brutal period of selling since then. The stock’s nearly 40% decline saw it crash through its 50-DMA, and in the past few days, it has found support at its longer term 200-DMA.
Again, the S&P 500 and its sectors use a market-cap-weighted methodology, meaning stocks with larger market caps (like Tesla) will have a greater impact on the index than smaller peers. That also makes equal-weight versions of the indices useful in canceling out some of that noise and providing a better look at breadth. As shown below, whereas the market-cap weighted sector ETF (XLY) is down 9.6% from a 52-week high, the equal weight version (RSPD) is down less than 3%. Furthermore, whereas XLY looks like a falling knife, RSPD has just been bouncing sideways along the 50-DMA. The latest lows for RSPD came right at the uptrend line off of last summer’s lows. So all together, while the weakness in the Consumer Discretionary sector may cause some alarms to go off as a sign of stress for the consumer, the current situation is more looking like a lesson in index weighting methodologies and mega-cap volatility.


Feb 27, 2025
Log-in here if you’re a member with access to the Closer.
Looking for deeper insight into markets? In tonight’s Closer sent to Bespoke Institutional clients, we begin with a look at the enormous number of mentions on tariffs on conference calls and what that means for uncertainty (page 1). We then review the latest GDP data (page 2) and earnings reports released after the bell (page 3). Next, we review the sharp drop in AI names (page 4) followed by an update of our KISS basket (page 5).

See today’s full post-market Closer and everything else Bespoke publishes by starting a 14-day trial to Bespoke Institutional today!
Feb 27, 2025
It was a big day for scheduled Thursday releases. For starters, weekly sentiment data showed a huge spike in bearish sentiment (which we covered in today’s Chart of the Day and Morning Lineup), and among the economic data releases, jobless claims experienced a notable spike. For seasonally adjusted initial claims through the week of 2/22, claims totaled 242K, up 22K from the previous week’s upward revision of 220K. As shown below, at those levels, claims have returned to the upper end of the past few years’ range with this marking the largest single-week increase since a 35K surge in October.

Before seasonal adjustment, claims totaled 220.5K. That is up versus the comparable week of the past two years and is more in line with levels from February 2022, meaning that claims are up relative to recent years but not extraordinarily high. On the bright side, claims are moving in line with seasonally normal patterns, as shown in the second chart below. Claims will likely continue to have these seasonal tailwinds out through the spring.

Nationally, claims are higher, but it is hard to classify it as too much of a concern- yet. Additionally, state-level data offers some insight into the uptick. Among many changes, thanks to the new administration taking office, the federal government has been getting a shake-up from audits from the Department of Government Efficiency (DOGE). There have already been job losses as a result of these attempts to curtail government spending, which is showing up through DC area claims. We first noted the increase in claims in the Washington DC metro area in last Thursday’s Closer, and the updated data one week later has reaffirmed more jobs have been lost. As shown below, claims from the capital have risen above 2,000 for the first time since Q1 2023, which was around the time of a looming debt ceiling standoff. Before that, the only other spikes of similar size or larger were the COVID period and the 2018-2019 government shutdown.

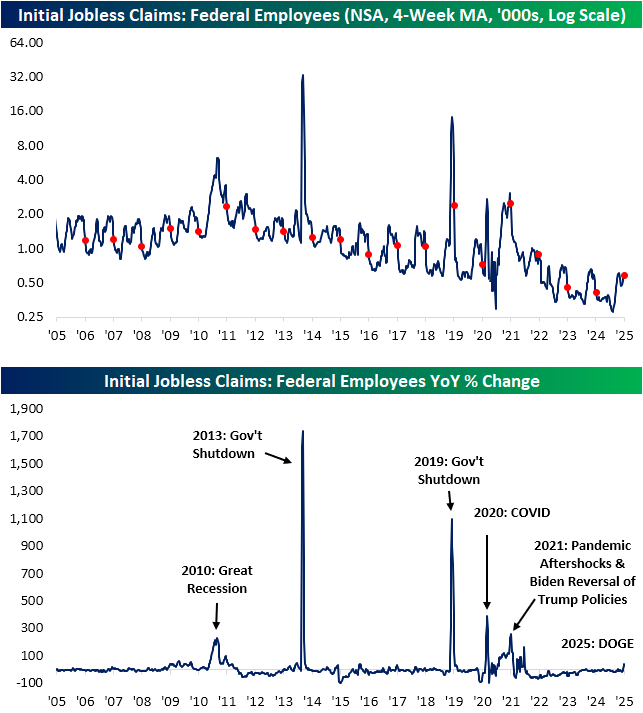
Of course, looking at claims in the DC area is only one proxy for the loss in government jobs. The Department of Labor also offers a look at claims filed in federal programs. These, of course, are a more direct look at government job loss. As shown in the first chart below, federal employee claims have generally trended lower over the past 15 or so years, having been near record lows (at the time of seasonal annual lows) in the past several years. This time of year usually sees an unwinding of a seasonal spike in claims, but this year, the opposite has been playing out, with claims continuing to move higher in the past couple of weeks.
In fact, the four-week moving average for federal employee claims has risen over 40% on a year-over-year basis. As shown in the second chart below, that spike hardly registers when put up against things like government shutdowns and recessions. One comparable spike worth mentioning, though, is from early 2021, shortly after Biden took office. That was another period with a notable spike in federal claims thanks to hiring freezes and employment reductions due to policy shifts moving from one administration to another. In other words, the recent DOGE job cuts have some very recent parallels.
Obviously, it’s still early in the game. It’s only been a little more than a month since President Trump’s inauguration, so it wouldn’t be surprising to see government-related claims continue rising as DOGE continues its auditing. With that in mind, federal employee continuing claims are right about where they were for this time last year. Additionally, like initial claims, those levels are at a seasonal inflection point and are considerably lower than what they have been in past decades.
