Fixed Income Weekly — 11/29/23
Searching for ways to better understand the fixed income space or looking for actionable ideas in this asset class? Bespoke’s Fixed Income Weekly provides an update on rates and credit each week. We start off with a fresh piece of analysis driven by what’s in the headlines or driving the market in a given week. We then provide charts of how US Treasury futures and rates are trading, before moving on to a summary of recent fixed-income ETF performance, short-term interest rates including money market funds, and a trade idea. We summarize changes and recent developments for a variety of yield curves (UST, bund, Eurodollar, US breakeven inflation, and Bespoke’s Global Yield Curve) before finishing with a review of recent UST yield curve changes, spread changes for major credit products and international bonds, and 1-year return profiles for a cross-section of the fixed income world.

Our Fixed Income Weekly helps investors stay on top of fixed-income markets and gain new perspectives on the developments in interest rates. You can sign up for a Bespoke research trial below to see this week’s report and everything else Bespoke publishes for the next two weeks!
Click here and start a 14-day free trial to Bespoke Institutional to see our newest Fixed Income Weekly now!
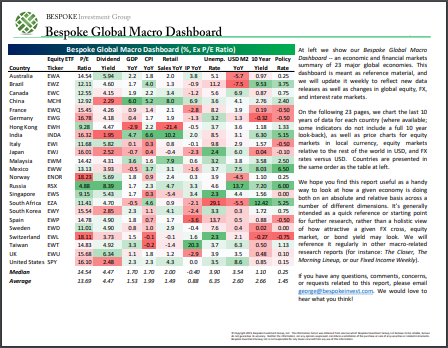
Bespoke’s Global Macro Dashboard — 11/29/23
Bespoke’s Global Macro Dashboard is a high-level summary of 22 major economies from around the world. For each country, we provide charts of local equity market prices, relative performance versus global equities, price to earnings ratios, dividend yields, economic growth, unemployment, retail sales and industrial production growth, inflation, money supply, spot FX performance versus the dollar, policy rate, and ten year local government bond yield interest rates. The report is intended as a tool for both reference and idea generation. It’s clients’ first stop for basic background info on how a given economy is performing, and what issues are driving the narrative for that economy. The dashboard helps you get up to speed on and keep track of the basics for the most important economies around the world, informing starting points for further research and risk management. It’s published the last Wednesday of every month at the Bespoke Institutional membership level.
You can access our Global Macro Dashboard by starting a 14-day free trial to Bespoke Institutional now!
Flash PMIs Mixed
Predicting the direction of the US or global economy has always been a humbling profession, but doing it in the post-Covid economy where monetary and fiscal activity has gone into ‘Ludicrous’ mode only makes an impossible job even harder. The latest releases of global flash PMI readings for November from S&P Global only add to the already long list of examples. As discussed with the overseas releases in The Morning Lineup (link) earlier today, these indices make up about 85% of responses for the final PMI reading in a given month. As for the US, manufacturing activity, as measured by the PMIs, slipped back into contraction during November. Manufacturing PMI has now been at or below 50 for 12 of the last 13 months and the last 7 straight, and S&P Global noted that “demand conditions stagnated” at US factories. As for Services, activity beat and rose sequentially, marking the 10th straight month of expansion (a reading above 50).
As shown in the charts below, historically US PMIs have been a solid guide to global activity, explaining about 80% of the variation in global manufacturing and services activity. When we do the same analysis for the average across flash economies, we do even better as these readings explain 89% or more of the variation (0.89 for manufacturing and 0.94 for the services sector).

While the US readings and the average of the global flash readings have both done a good job as a guide to the global economy, their short-term moves in November were contradictory. In the charts below, we show the US, global, and an average of all the readings for economies that report flash PMIs. As shown, for both the manufacturing and services sectors, average flash data tends to be a pretty consistent guide to where global final data (green line) for a given month ends up and confirms the results from the chart above. For this month, though, in both the manufacturing and the services sectors, the direction of the US reading was in the opposite direction as the average flash readings of its global peers. This is hardly the first (or the last) time these readings will move in opposite directions on a month-to-month basis, but it doesn’t help what is an already confusing environment to navigate.

The Closer – Geopolitics Tidbits, Durable Goods, UMich, EIA – 11/22/23
Log-in here if you’re a member with access to the Closer.
Looking for deeper insight into markets? In tonight’s Closer sent to Bespoke Institutional clients, we go through some notable headlines from today covering Canada, India, and the Netherlands. We also preview four overnight central bank decisions (page 1). Today saw the release of durable goods data (page 2), University of Michigan consumer sentiment data (page 2), and EIA petroleum inventories (page 3).

See today’s full post-market Closer and everything else Bespoke publishes by starting a 14-day trial to Bespoke Institutional today!