Jul 28, 2025
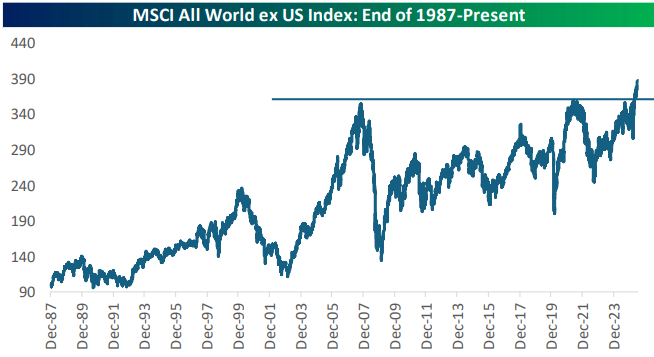
The plight of international equities for the last twenty years is well known to most investors, but in the last month or so, we’ve finally seen them break out to new all-time highs above two key resistance levels. Below is a chart of the MSCI All World ex US index, which basically tracks international equities as a whole. After a massive move higher in the first half of the 2000s, the Financial Crisis did a number on international stocks, and by the time COVID rolled around in early 2020, they had just barely gotten back to their pre-Financial Crisis highs. International equities recovered from the COVID Crash much more slowly than the US, and it has taken until this year for them to finally break out again. Are we now finally set for another big leg higher in international equities as the US works to make new trade deals with both friends and foes?
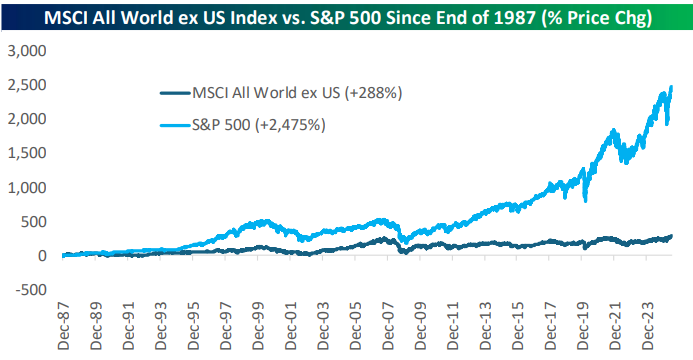
The massive underperformance of international equities versus the US can been seen in the chart below. Since the end of 1987, the US has beaten international equities by nearly 9x, with the S&P 500 gaining nearly 2,500% compared to a gain of 288% for the MSCI World ex US.

Jul 25, 2025
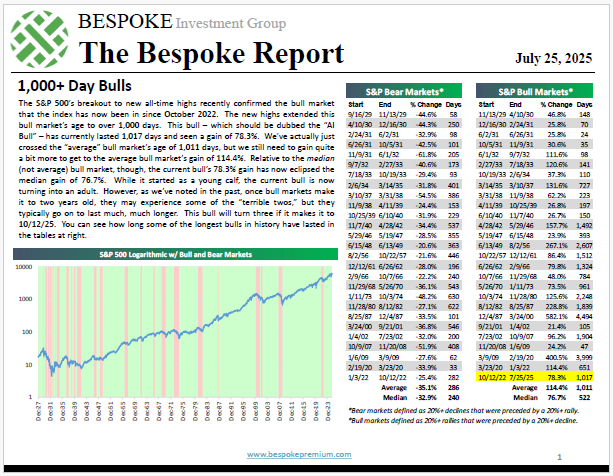
To read our weekly Bespoke Report newsletter and access everything else Bespoke’s research platform offers, start a two-week trial to Bespoke Premium. In this week’s report, we cover the bull market crossing the 1,000-day mark, underlying index technicals, how much the Fed should be cutting rates based on where inflation and employment stand, our unique Netscape vs. ChatGPT analysis, earnings season, longshot stocks, and more.

Jul 18, 2025
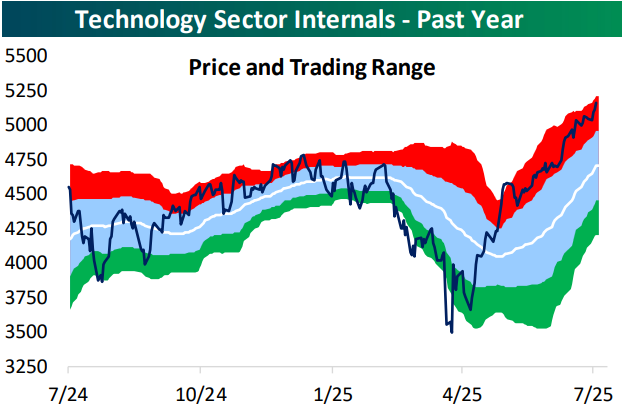
Below is a look at a one-year price chart of the S&P 500 Technology sector. The white line represents the sector’s 50-day moving average, while the light blue shading represents its “normal” trading range, which is a band that’s one standard deviation above and below the 50-DMA. The red shading is one to two standard deviations above the 50-DMA, which we consider “overbought” territory, and anything above the top of the red band is more than two standard deviations above the 50-day. The green shading is the opposite of the red zone: one to two standard deviations below the 50-DMA, which we consider “oversold.”
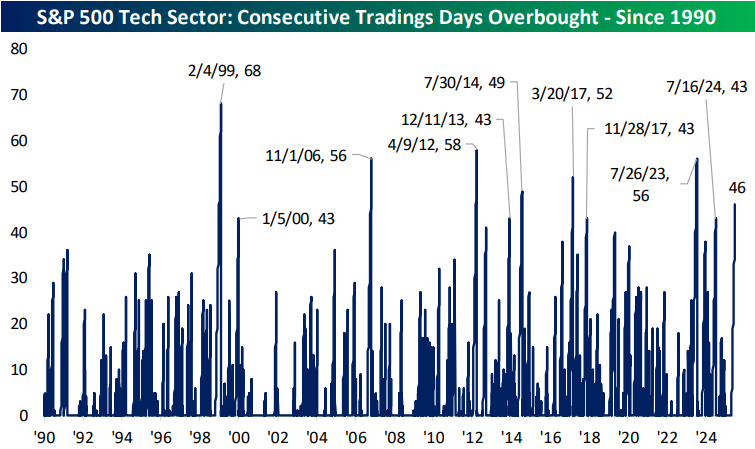
The Tech sector has now rallied 45% since its low point in early April, leaving it at all-time highs. The sector has also now closed in “overbought” territory for 46 straight trading days (heading into Friday).
This is the 11th time since 1990 that the Tech sector has closed in overbought territory for at least 40 straight trading days. Yesterday we looked at how the sector has done going forward after prior lengthy overbought streaks in our post-market macro note, The Closer. You can read that report with proper access here.
The longest the Tech sector has remained in overbought territory is the 68-trading day streak that ended in February 1999. At its current level, the sector would need to fall 3.5% for the “overbought” streak to end, so unless we get a big drop early next week, it looks like the current streak will make it to the 50-day mark.
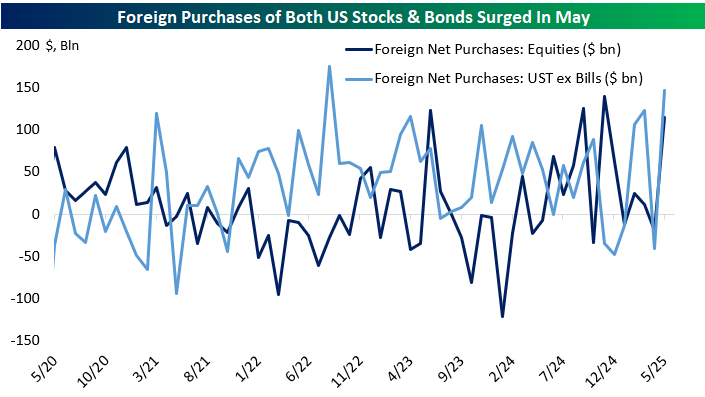
Jul 18, 2025
After the close yesterday, the US Treasury reported the largest inflow of foreign capital to that market (net purchases) since 2022, obliterating the narrative that foreign investors are fleeing Treasuries (or US assets generally) due to concerns over political risk or as a response to tariffs. Adding to that news was a large inflow to US stocks, similar in magnitude to the ones we saw last fall. While there was panic about the end of the “US exceptionalism” trade back in April, for now, there’s no sign in the data that foreign investors are fleeing.