Key ETF Asset Class Performance
The market ended the month of July on a down note, but the S&P 500 (SPY) still ended the month with a gain of 2.3%. The Dow (DIA) only gained 0.2%, however, while the Tech-heavy Nasdaq 100 (QQQ) gained 2.4%. While the cap-weighted S&P gained more than 2%, the equal-weight version of the index (RSP) gained just 1%.
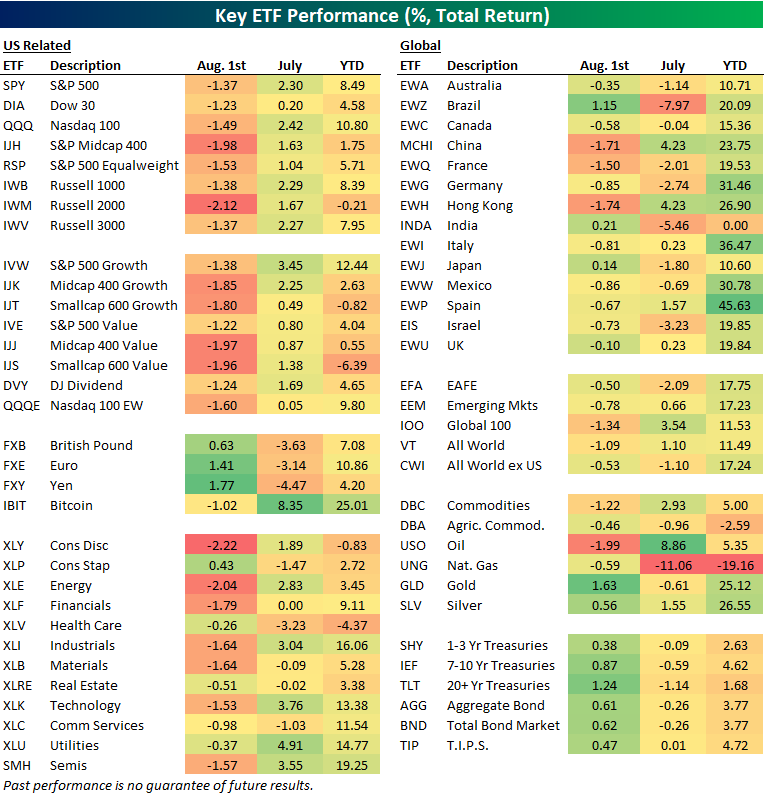
Above is a look at recent performance across asset classes using our key ETF matrix. For each ETF, we show its year-to-date change through July, its performance in July, and its performance today on the first trading day of August.
While domestic equities posted small gains in July, there was quite a bit of disparity among international markets. The all-world ex US ETF (CWI) actually fell 1.1% in July, while countries like Brazil (EWZ), France (EWQ), Germany (EWG), India (INDA), Japan (EWJ), and Israel (EIS) fell even more than that. China (MCHI) and Hong Kong (EWH) went the other way with gains of more than 4% during the month. On the year, China (MCHI) finished July up 23.75% year-to-date, which is much better than SPY’s 8.5% gain. Notably, India (INDA) ended July exactly flat on the year, which trails basically every other country around the world in terms of 2025 equity market returns.
Getting back to the US, sector returns have been scattered recently, with areas like Consumer Staples (XLP) and Health Care (XLV) selling off in July, while Industrials (XLI), Tech (XLK), and Utilities (XLU) — all areas benefitting from the AI Boom and its build-out — rallied.
To start August, however, Consumer Staples (XLP) and Health Care (XLV) are holding up well while the rest of the market plunges today.
In terms of large-caps versus small-caps, yet again, the small-cap Russell 2,000 (IWM) is lagging. IWM is down 2.1% today after finishing July in the red on a year-to-date basis. The small-cap value ETF (IJS) ended July down 6.4%. That’s nearly 15 percentage points weaker than the 8.5% gain seen for the large-cap SPY. Will small-caps ever outperform again?

The Bespoke 50 Growth Stocks — 7/31/25
The “Bespoke 50” is a basket of noteworthy growth stocks in the Russell 3,000. To make the list, a stock must have strong earnings growth prospects along with an attractive price chart based on Bespoke’s analysis. There were 15 changes to the list this week.
The Bespoke 50 is available with a Bespoke Premium subscription or a Bespoke Institutional subscription. With Bespoke Premium, you’ll receive a number of daily market updates from us along with our weekly newsletter and a portion of our investor tools. With Bespoke Institutional, you’ll receive everything that’s included with Premium plus additional daily macro analysis and more stock-specific research.
To see all 50 stocks that currently make up the Bespoke 50, simply start a two-week trial to Bespoke Premium or Bespoke Institutional.
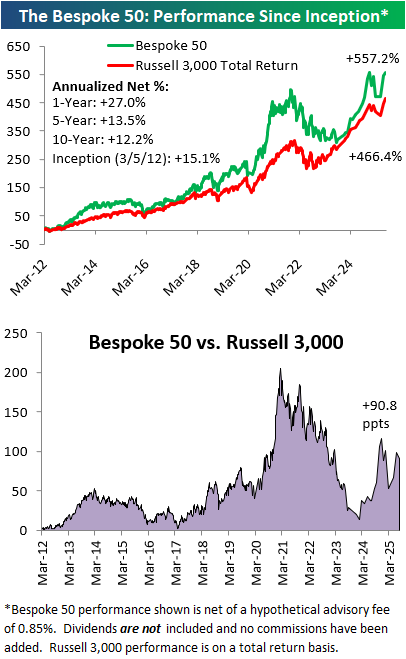
The Bespoke 50 performance chart shown does not represent actual investment results. The Bespoke 50 is updated monthly on Thursdays unless otherwise noted. Performance is based on equally weighting each of the 50 stocks (2% each) and is calculated using each stock’s opening price as of Friday morning after publication. Entry prices and exit prices used for stocks that are added or removed from the Bespoke 50 are based on Friday’s opening price. Any potential commissions, brokerage fees, or dividends are not included in the Bespoke 50 performance calculation, but the performance shown is net of a hypothetical annual advisory fee of 0.85%. Performance tracking for the Bespoke 50 and the Russell 3,000 total return index begins on March 5th, 2012 when the Bespoke 50 was first published. Past performance is not a guarantee of future results. The Bespoke 50 is meant to be an idea generator for investors and not a recommendation to buy or sell any specific securities. It is not personalized advice because it in no way takes into account an investor’s individual needs. As always, investors should conduct their own research when buying or selling individual securities. Click here to read our full disclosure on hypothetical performance tracking. Bespoke representatives or wealth management clients may have positions in securities discussed or mentioned in its published content.
The Carvana (CVNA) Comeback
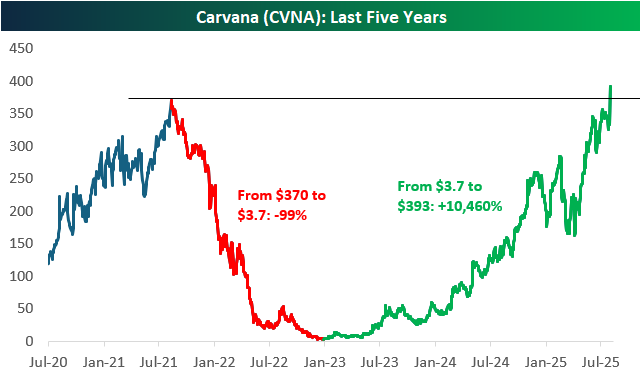
Even if you’ve been following markets for decades, you’ve likely never seen anything as crazy as the comeback that online used-car company Carvana (CVNA) has experienced in the last couple of years. Big stocks like Netflix (NFLX) and Meta (META) saw massive drawdowns of 75%+ during the bear market of 2021 and 2022, but Carvana (CVNA) was on another level with a decline of 99% from a peak of $370/share to its closing low of $3.72 made on 12/27/22.
As shown below, a stock that falls 70% needs to gain 233% to get back to even. That’s a tall task, but it at least seems do-able. A stock that falls 99%, however, needs to gain 9,900% to get back to even. That seems downright impossible!
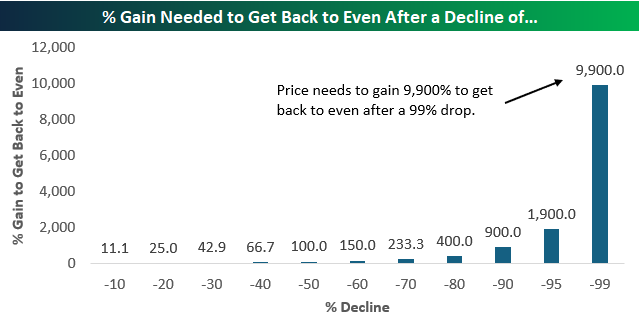
Below is a price chart of Carvana (CVNA) over the last five years. As of today, with the stock currently up 17% on earnings to $393/share, CVNA has not only fully recovered its 99% drawdown, but it has also eclipsed its prior highs. In less than three years, the stock has gained 10,460%! Maybe you have, but we’ve never seen any recovery quite this remarkable.
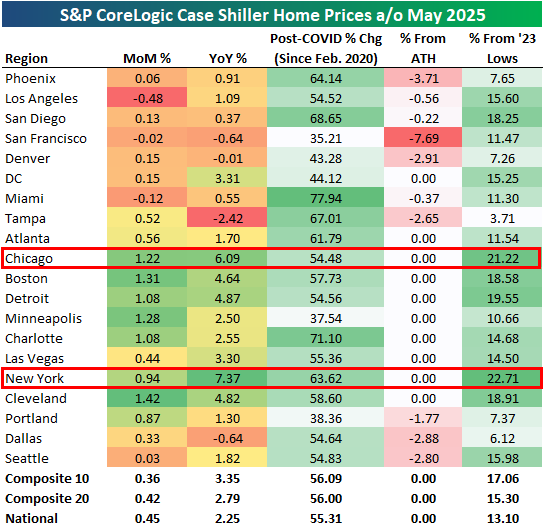
New York and Chicago On Top
The latest monthly data on home prices was published earlier this week from S&P CoreLogic’s Case Shiller indices. Case Shiller indices are published on a two-month lag, but they break down price levels across twenty major cities around the country.
Below is a look at the latest data. Seventeen of twenty cities were up month-over-month, with many cities up more than 1%: Chicago, Boston, Detroit, Minneapolis, Charlotte, and Cleveland. The three cities that were down m/m were Los Angeles, San Francisco, and Miami.
On a year-over-year basis, the national reading came in at +2.25%, but there’s quite a bit of disparity across cities. Tampa, Dallas, San Francisco, and Denver are actually down year-over-year, while New York and Chicago are up 6%+. New York is actually up the most of any city tracked over the last year with home price gains of 7.4%.
Exactly half of the twenty cities tracked hit new all-time highs in May. San Francisco is the city where prices are down the most from their highs at -7.7%.
Back in 2022 and early 2023, we saw a dip in home prices after seeing a huge post-COVID surge in 2020 and 2021. Since that dip, though, prices nationally have rallied roughly 13%. The two cities that have seen the biggest rallies since their 2023 lows are Chicago and New York, which are both up more than 20%.
In terms of prices, given their y/y readings and their gains since early 2023, New York and Chicago have been the hottest markets in the last couple of years. Conversely, the West Coast and Southeast have seen the most weakness.