Aug 29, 2025
The largest company in the world — NVIDIA (NVDA) — reported quarterly earnings on Wednesday (8/27) after the close, and you can read our review of NVDA’s conference call here if you’re interested.
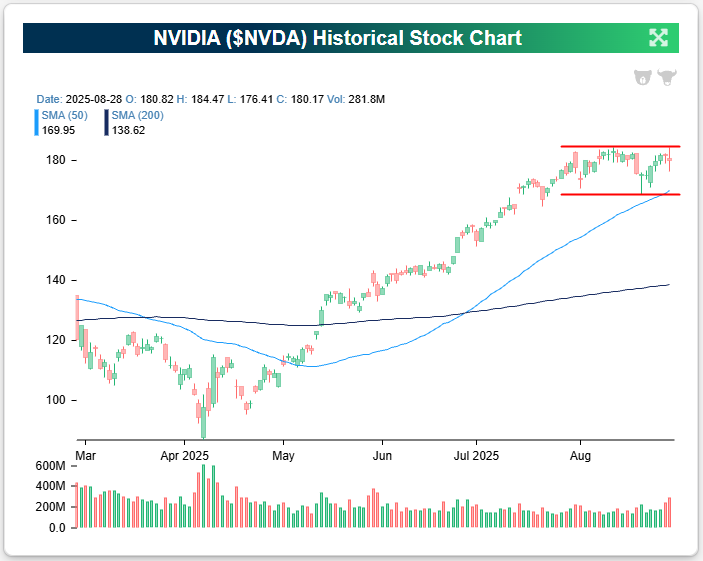
While NVIDIA (NVDA) has historically averaged a one-day change of nearly +/-8% following earnings, its reaction to this quarter’s report was a decline of less than 1%. As you can see in the chart below, bulls went into NVDA earnings hoping the stock would break out to new highs after a period of sideways action since mid-July. That breakout has yet to materialize, though, and today we’re seeing shares head lower by 2-3% again. For now, new highs for NVDA appear to be on hold.
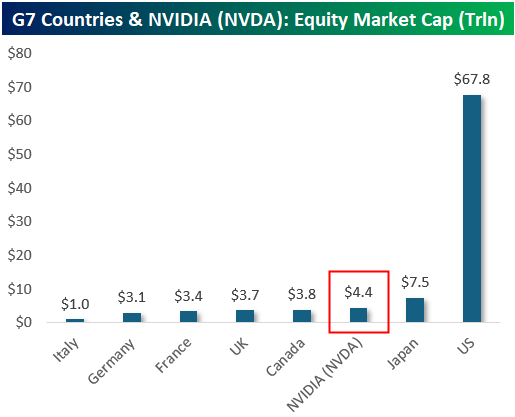
Below are a few charts that highlight just how gigantic NVIDIA (NVDA) has become. The first stacks NVDA’s market cap against the world’s largest economies. At $4.4 trillion, NVIDIA is now bigger than the entire equity markets of five of the seven G7 countries—Italy, Germany, France, the U.K., and Canada. Japan is the only non-US country in the G7 with a larger market cap. That means one U.S. company, riding the AI wave, is worth more than the combined value of every publicly traded company in several of the world’s most advanced economies.
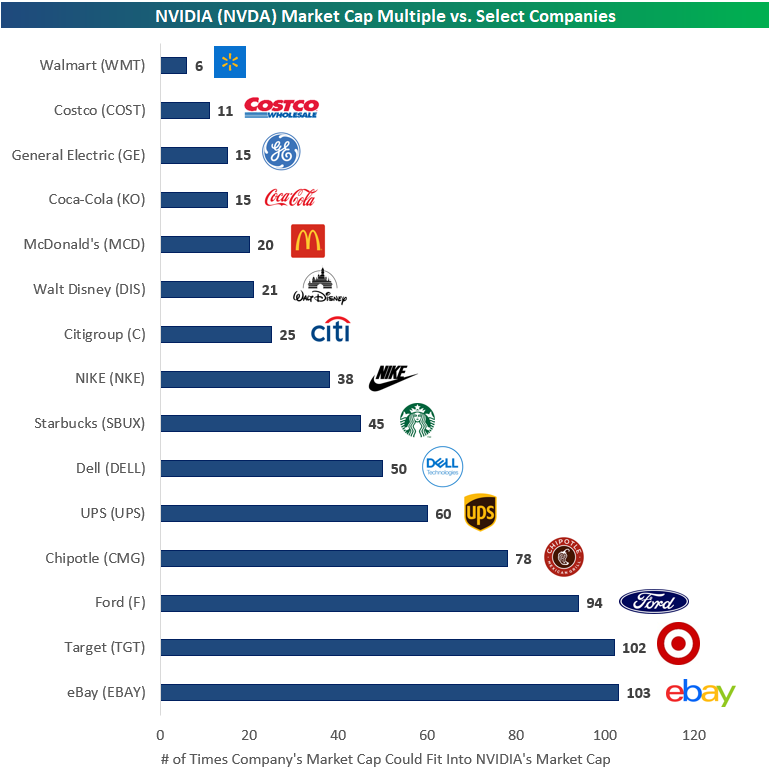
If you thought comparing NVIDIA to entire countries was wild, our next chart shows just how far ahead it is of some of America’s most iconic companies. With a market cap north of $4 trillion, NVIDIA is worth 6 Walmarts (WMT), 11 Costcos (COST), 20 McDonald’s (MCD), or 25 Citigroups (C). Taking it further, it could swallow 38 Nikes (NKE), 45 Starbucks (SBUX), or 50 Dells (DELL). At the extreme end, NVIDIA’s value equals about 60 UPS (UPS), 78 Chipotles (CMG), 94 Fords (F), 102 Targets (TGT), or 103 eBays (EBAY). Put simply, NVIDIA’s market cap isn’t just massive, it’s in a league of its own, making even household corporate giants look like small caps by comparison.
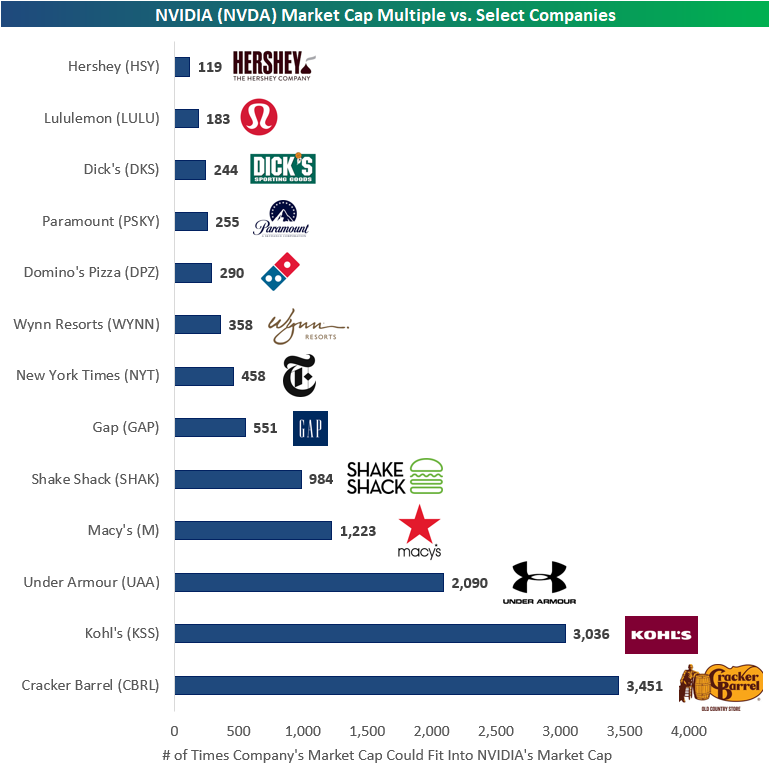
Our last chart pushes the point even further: NVIDIA’s market cap doesn’t just dwarf corporate icons, it makes many popular consumer brands look minuscule. At today’s size, NVIDIA is worth the same as 119 Hersheys (HSY), 183 Lululemons (LULU), or 244 Dick’s Sporting Goods (DKS). It could equal 290 Domino’s (DPZ), 358 Wynn Resorts (WYNN), or 458 New York Times (NYT). Stretch it further, and you get jaw-dropping multiples: 551 Gaps (GAP), 984 Shake Shacks (SHAK), 1,223 Macy’s (M), 2,090 Under Armours (UAA), 3,036 Kohl’s (KSS), or an incredible 3,451 Cracker Barrels (CBRL). When one company is worth thousands of other recognizable brands outright, it underscores just how unprecedented NVIDIA’s dominance has become.

Aug 28, 2025
The “Bespoke 50” is a basket of noteworthy growth stocks in the Russell 3,000. To make the list, a stock must have strong earnings growth prospects along with an attractive price chart based on Bespoke’s analysis. There were 6 changes to the list this week.
The Bespoke 50 is available with a Bespoke Premium subscription or a Bespoke Institutional subscription. With Bespoke Premium, you’ll receive a number of daily market updates from us along with our weekly newsletter and a portion of our investor tools. With Bespoke Institutional, you’ll receive everything that’s included with Premium plus additional daily macro analysis and more stock-specific research.
To see all 50 stocks that currently make up the Bespoke 50, simply start a two-week trial to Bespoke Premium or Bespoke Institutional.
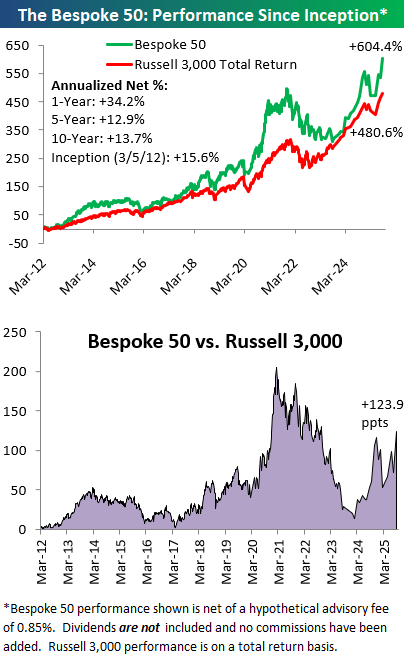
The Bespoke 50 performance chart shown does not represent actual investment results. The Bespoke 50 is updated monthly on Thursdays unless otherwise noted. Performance is based on equally weighting each of the 50 stocks (2% each) and is calculated using each stock’s opening price as of Friday morning after publication. Entry prices and exit prices used for stocks that are added or removed from the Bespoke 50 are based on Friday’s opening price. Any potential commissions, brokerage fees, or dividends are not included in the Bespoke 50 performance calculation, but the performance shown is net of a hypothetical annual advisory fee of 0.85%. Performance tracking for the Bespoke 50 and the Russell 3,000 total return index begins on March 5th, 2012 when the Bespoke 50 was first published. Past performance is not a guarantee of future results. The Bespoke 50 is meant to be an idea generator for investors and not a recommendation to buy or sell any specific securities. It is not personalized advice because it in no way takes into account an investor’s individual needs. As always, investors should conduct their own research when buying or selling individual securities. Click here to read our full disclosure on hypothetical performance tracking. Bespoke representatives or wealth management clients may have positions in securities discussed or mentioned in its published content.
Aug 26, 2025
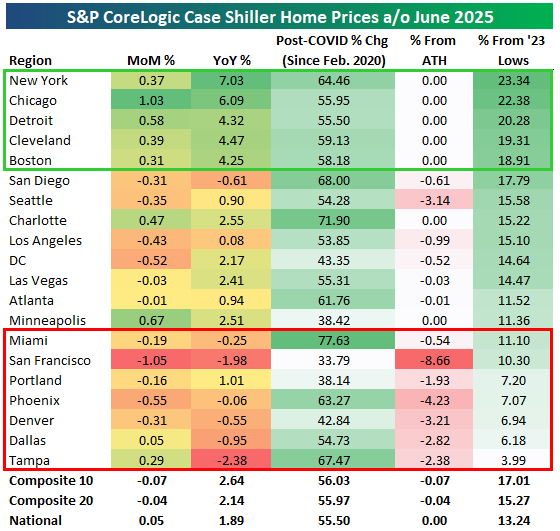
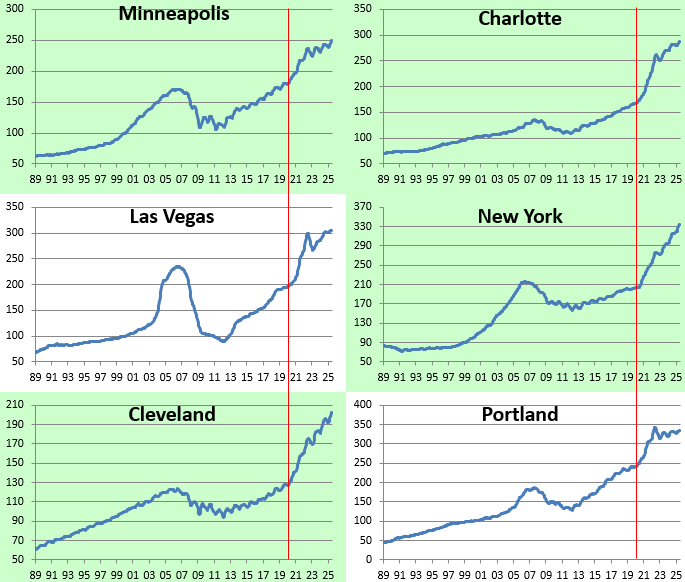
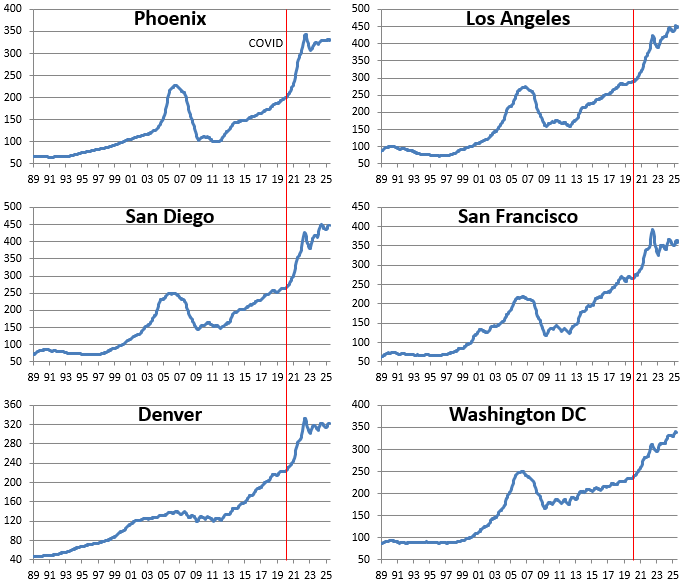
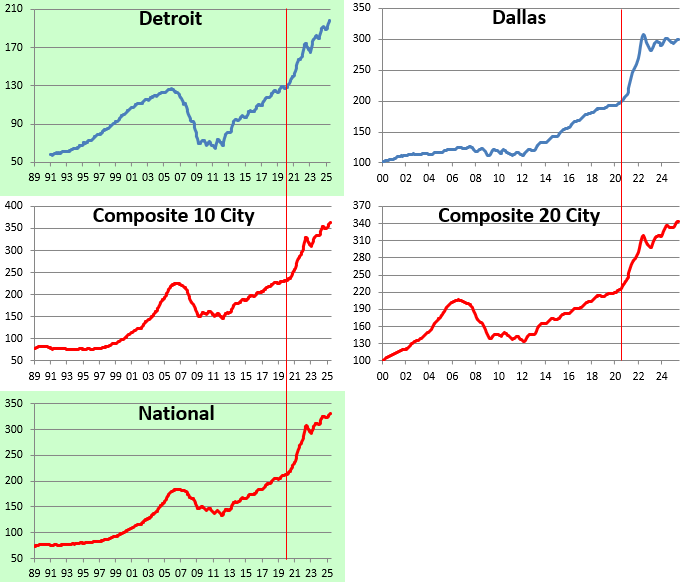
Below is an updated look at the most recent release of S&P/CoreLogic Case Shiller Home Price indices. As of June 2025, the data shows national home prices up 1.89% year-over-year and 55.5% since February 2020, with the Composite 20 index just 0.15% below all-time highs. On a monthly basis, price changes were mixed across regions, with Chicago (+1.03%), Detroit (+0.58%), and Minneapolis (+0.67%) posting the strongest gains, while San Francisco (-1.05%), Dallas (-0.92%), and Seattle (-0.35%) recorded declines. Year-over-year growth is most pronounced in New York (+7.03%), Chicago (+6.09%), and Detroit (+4.32%), while markets like San Francisco (-1.98%), Tampa (-2.38%), and San Diego (-0.61%) are down versus last year.
Since the onset of COVID, most markets remain significantly higher, led by Miami (+77.6%), Charlotte (+71.9%), and Tampa (+67.5%). By contrast, San Francisco (+33.8%), Minneapolis (+38.4%), and Portland (+38.1%) have seen the smallest increases. Relative to all-time highs, only a handful of markets are meaningfully below peak levels, including San Francisco (-8.7%), Portland (-4.2%), and Phoenix (-3.7%), while many regions like New York, Chicago, Detroit, and Boston are right at record highs. From their 2023 lows, markets like New York (+23.3%), Chicago (+22.4%), and Detroit (+20.3%) have rebounded sharply, while cities such as Tampa (+3.9%) and Denver (+6.9%) have recovered more modestly.
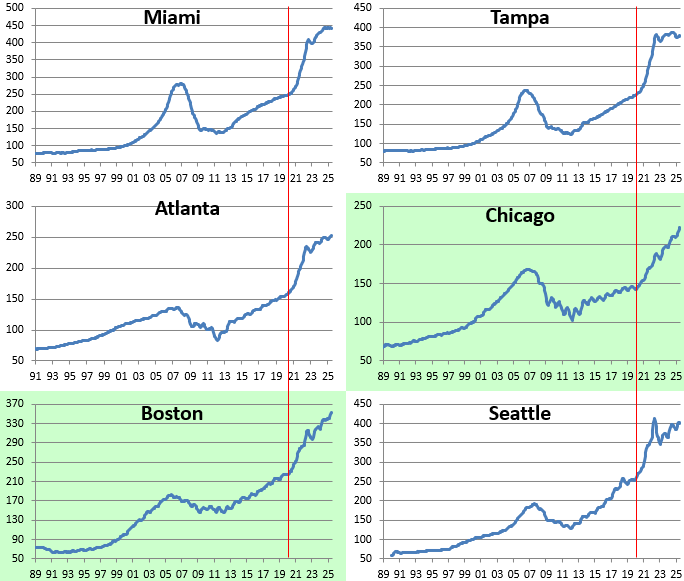
Below are price charts for each of the major cities tracked by Case Shiller going back to the end of 1989. Cities highlighted in green hit all-time highs in June. In looking at the charts, you’ll notice sideways action recently in previously hot markets in the sunbelt and out west, while supply-constrained areas like New York, Chicago, Boston, Cleveland, and Detroit continue to see home prices push higher and higher.
Aug 26, 2025
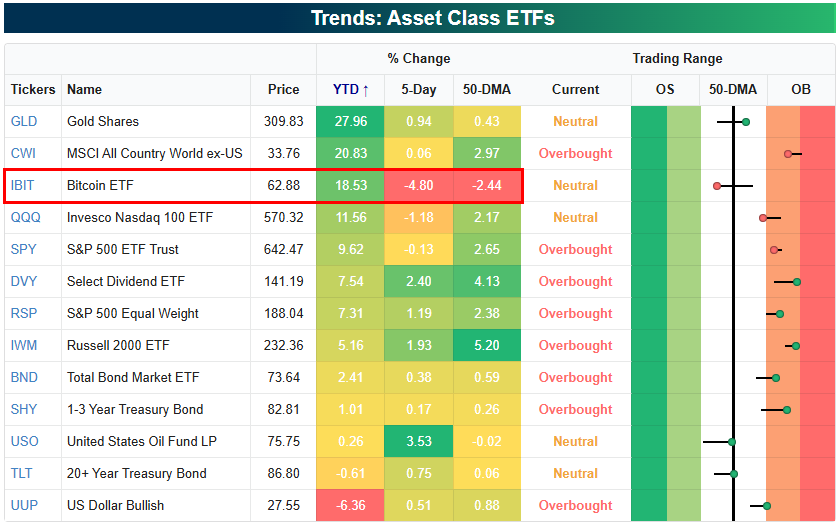
Equities have stalled out in the last half of August as a buyer’s strike ahead of the seasonally weak month of September takes hold. Below is a look at where equity ETFs and other asset-class ETFs stand within their trading ranges using our Trend Analyzer tool. Notably, gold (GLD) is now solidly in the lead in terms of year-to-date percentage change after Bitcoin (IBIT) has fallen off dramatically in the last week. Of the various asset class ETFs shown, Bitcoin (IBIT) is easily down the most week-over-week with a drop of 4.8%. On the flip side, oil (USO) is up the most with a gain of 3.5%.
Looking at the mega-caps, the best performer over the last week has been Tesla (TSLA), which remains the worst performer of the group on a year-to-date basis. Alphabet (GOOGL) is the only other mega-cap in the green over the last week, while the rest of them are down 1%+. So far, Microsoft (MSFT) is the only one that has moved back below its 50-day moving average.

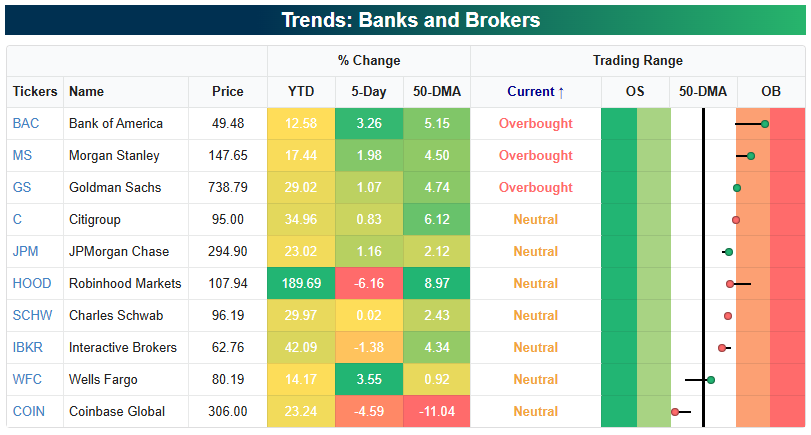
One other area of the market worth looking at is the banks and brokerage firms. While Bank of America (BAC) is up the least year-to-date of any of the stocks shown, it’s up the most over the last week with a gain of 3.3%. BAC is also now the most overbought stock of the bunch as it trades nearly two standard deviations above its 50-day moving average. On the flipside, Coinbase’s (COIN) 4.6% drop over the last week leaves it as the only name in the group that’s below its 50-DMA.
As a reminder, you can monitor trends across ETFs, sectors, groups, and indices using our Trend Analyzer tool, available to Bespoke members.