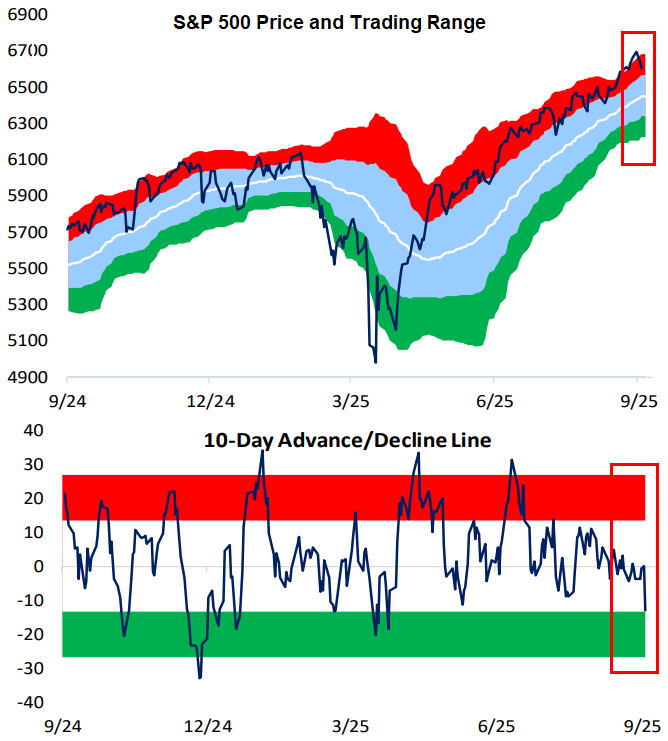
Price and 10-Day A/D Line Divergence
While the S&P 500 remains overbought in price (>1 standard deviation above its 50-DMA), its 10-day advance/decline line actually moved near oversold territory yesterday. The 10-day A/D line measures the average number of daily advancers minus decliners in an index over the last ten trading days. It’s a helpful measure of short-term market breadth. When the 10-day gets overbought, it’s a sign that stocks have had a large upward thrust over the last two weeks, often preceding some downside mean reversion. The opposite is also the case: when the 10-day gets oversold, it’s a sign that stocks within an index have struggled in the short-term, and thus upside mean reversion may be in store.
Usually, an index’s price and its 10-day track each other, but for the top-heavy S&P, there can be divergences because of how large the mega-caps have become. Because the mega-caps have held up well over the last two weeks, it has masked underlying weakness in the majority of stocks.
From a mean reversion perspective, the oversold 10-day suggests that the average stock could be in store for a bounce, while the mega-caps causing the S&P’s price to remain overbought could take a breather.
Bespoke subscribers can monitor the 10-day A/D line and other measures of breadth in our daily Sector Snapshot. If you’d like to check it out, start a trial to Bespoke Premium today.

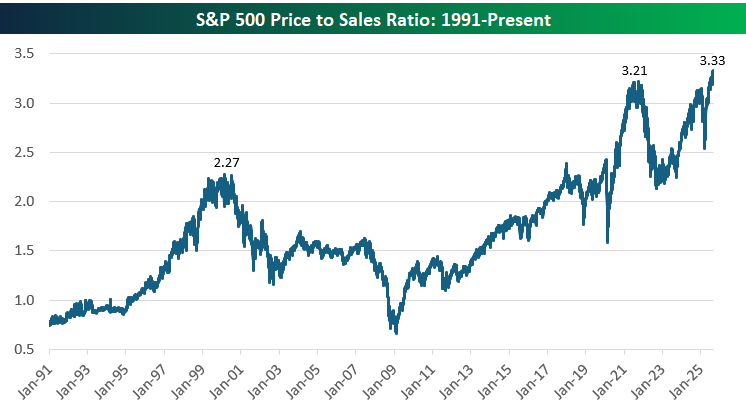
Record-High Price to Sales But Not For Equal Weight
As shown below, the S&P 500’s price-to-sales ratio has climbed to historically elevated levels, recently hitting 3.33. For context, the Dot-Com bubble peak in 2000 topped out at 2.27, and the post-COVID boom peaked at 3.21 before valuations pulled back. While strong corporate profitability and the AI growth theme have gotten us to these levels, this chart highlights just how extended valuations have become relative to revenues.
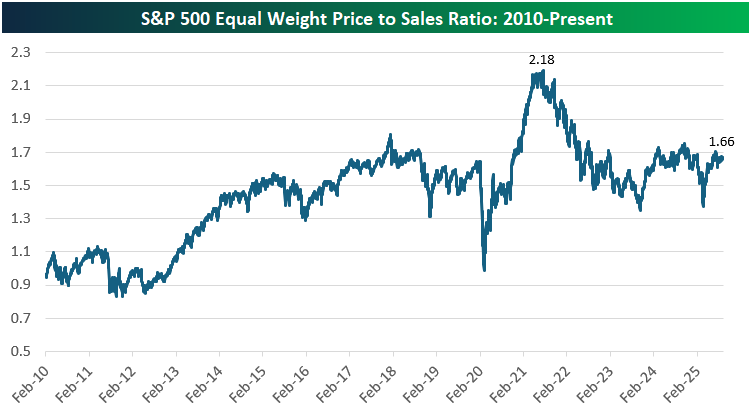
But there’s also a catch…
The equal-weighted version of the S&P 500 tells a different story, with its price-to-sales ratio currently sitting at 1.66, well below its 2021 peak of 2.18. This highlights the outsized role that mega-cap stocks have played in driving overall index valuations higher, as the typical stock trades at a much more modest multiple of sales compared to the market-cap-weighted index. While still elevated relative to the early 2010s, the equal-weight P/S ratio is right in the middle of its 12-year range. While valuation excesses are concentrated in the largest companies, much of the broader market is trading at far more reasonable levels.
The Bespoke 50 Growth Stocks – 9/25/25
The “Bespoke 50” is a basket of noteworthy growth stocks in the Russell 3,000. To make the list, a stock must have strong earnings growth prospects along with an attractive price chart based on Bespoke’s analysis. There were 7 changes to the list this week.
The Bespoke 50 is available with a Bespoke Premium subscription or a Bespoke Institutional subscription. With Bespoke Premium, you’ll receive a number of daily market updates from us along with our weekly newsletter and a portion of our investor tools. With Bespoke Institutional, you’ll receive everything that’s included with Premium plus additional daily macro analysis and more stock-specific research.
To see all 50 stocks that currently make up the Bespoke 50, simply start a two-week trial to Bespoke Premium or Bespoke Institutional.
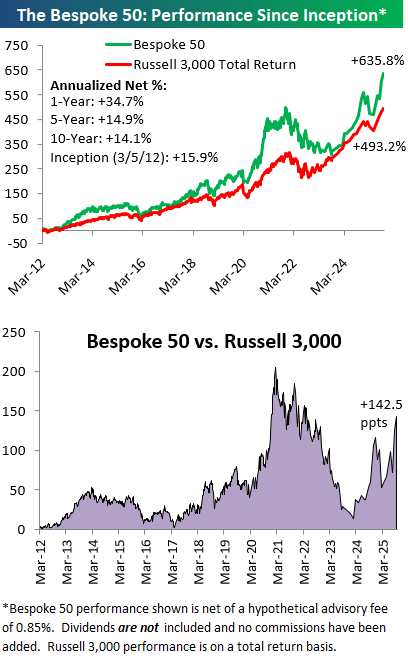
The Bespoke 50 performance chart shown does not represent actual investment results. The Bespoke 50 is updated monthly on Thursdays unless otherwise noted. Performance is based on equally weighting each of the 50 stocks (2% each) and is calculated using each stock’s opening price as of Friday morning after publication. Entry prices and exit prices used for stocks that are added or removed from the Bespoke 50 are based on Friday’s opening price. Any potential commissions, brokerage fees, or dividends are not included in the Bespoke 50 performance calculation, but the performance shown is net of a hypothetical annual advisory fee of 0.85%. Performance tracking for the Bespoke 50 and the Russell 3,000 total return index begins on March 5th, 2012 when the Bespoke 50 was first published. Past performance is not a guarantee of future results. The Bespoke 50 is meant to be an idea generator for investors and not a recommendation to buy or sell any specific securities. It is not personalized advice because it in no way takes into account an investor’s individual needs. As always, investors should conduct their own research when buying or selling individual securities. Click here to read our full disclosure on hypothetical performance tracking. Bespoke representatives or wealth management clients may have positions in securities discussed or mentioned in its published content.
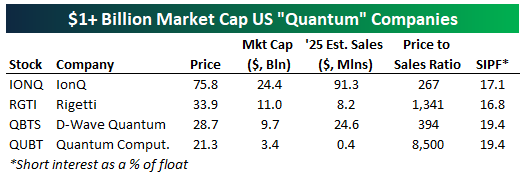
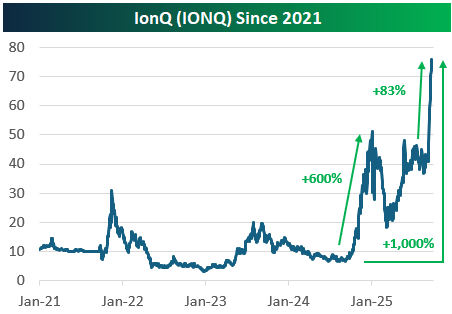
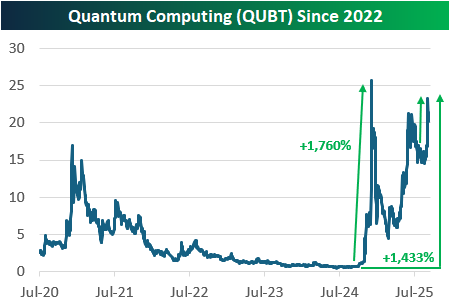
Eye-Popping Moves in Quantum Stocks
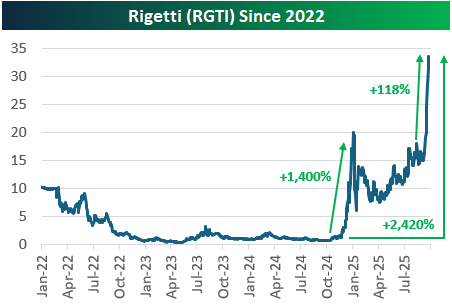
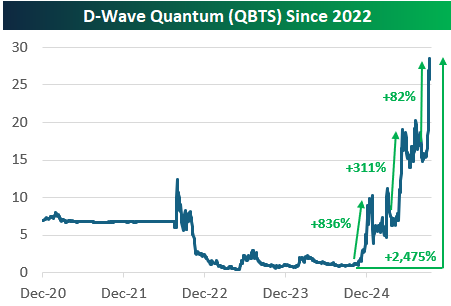
Quantum computing stocks have had another parabolic run recently. There are now four “quantum” stocks with market caps in the billions, and we provide recent price charts of them below.
IonQ (IONQ) is up the least of the bunch with a gain of 1,000% since its lows late last year. Quantum Computing (QUBT) is up the 3rd most with a gain of 1,433%, while Rigetti (RGTI) and D-Wave Quantum (QBTS) are both up more than 2,400%.
At their core, these “quantum” companies are working on the long-term promise of quantum computing: leveraging quantum mechanics to perform computations exponentially faster than today’s computers. The technology has the potential to transform industries such as cryptography, pharmaceuticals, and logistics, but the reality is that commercial viability remains decades away. Systems are still experimental, error-prone, and difficult to scale, with many breakthroughs required before they can solve real-world problems at scale. That hasn’t stopped speculators from bidding up quantum stocks to ungodly valuations, though.
As shown below, IONQ is projected to do $91.3 million in sales this year, which is the most of the group. Its market cap is all the way up to $24.4 billion, however, which gives it a price to sales ratio of 267! And that’s the smallest P/S ratio of the four stocks shown. 2025 sales estimates for RGTI are $8.2 million, while they’re $24.6 million for QBTS and just $400k for QUBT.