Homebuilders Struggle
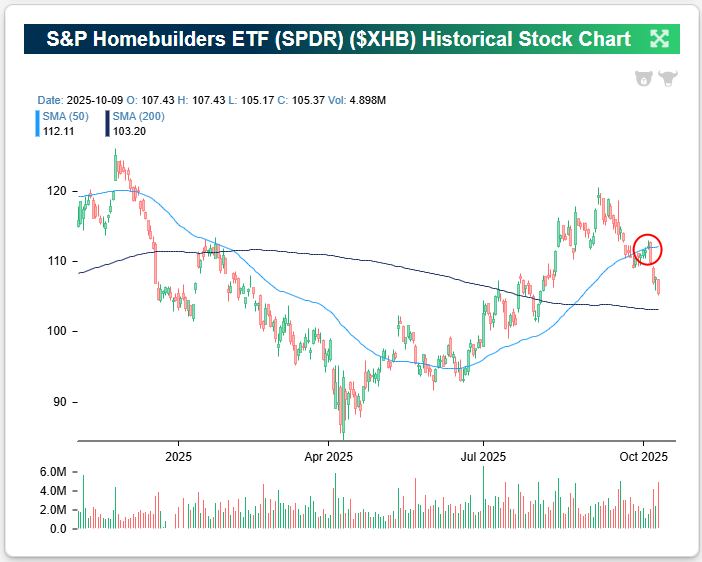
The foundation for homebuilder stocks has cracked over the last few weeks. As shown in the chart of the S&P Homebuilders ETF (XHB), an attempt to re-take the 50-DMA at the start of the week failed miserably, and the ETF enters today down 6.5% since Monday’s open.
What had been a solid uptrend off the April lows has now broken for XHB. (You can take a closer look at the chart for XHB here.)
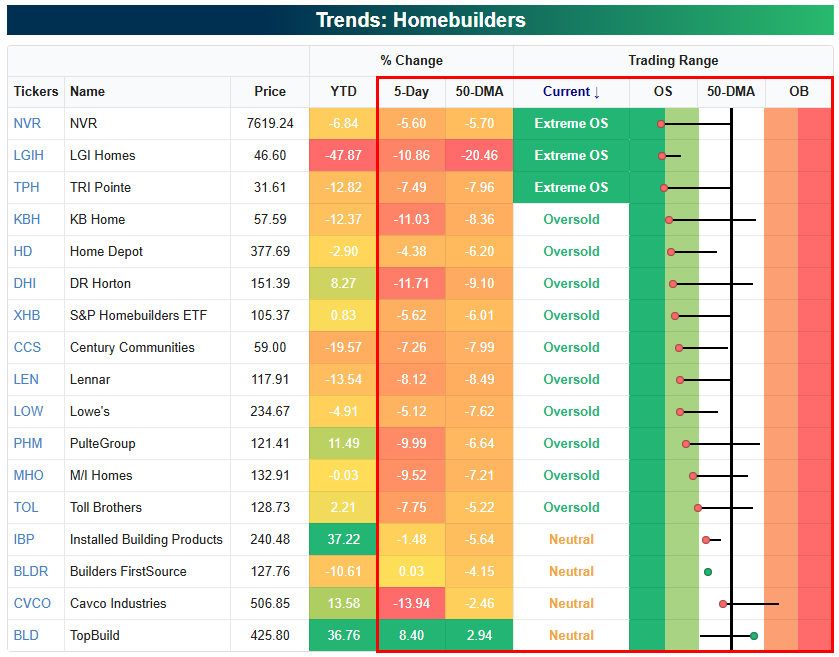
All but two homebuilder stocks in our snapshot below (from our Trend Analyzer tool) are down over the last week, with most down 5% or more. The recent move lower has left most of them in oversold territory, with three at “extreme” levels (>2 st. dev. below 50-DMA).
NVR, LGI Homes (LGIH), and TRI Pointe (TPH) are the three most oversold builders relative to their normal trading ranges, while KB Home (KBH) and DR Horton (DHI) are the next-most oversold.
The only housing-related stock in our snapshot that’s trading above its 50-DMA is TopBuild (BLD), which has bucked the trend and traded up 8% over the last week. The reason? Two days ago, TopBuild announced it was purchasing Specialty Products and Insulation – a wholesale distributor of insulation products – in an all-cash deal for $1 billion. While often-times companies doing the acquiring in an M&A transaction will initially see their shares trade lower, investors liked what they saw from this TopBuild purchase.

B.I.G. Tips – Is Another Biotech Boom Coming?
This content is for members onlyA Strong Six Months
Today marked six months since the US stock market made its “tariff crash” closing low on April 8th.
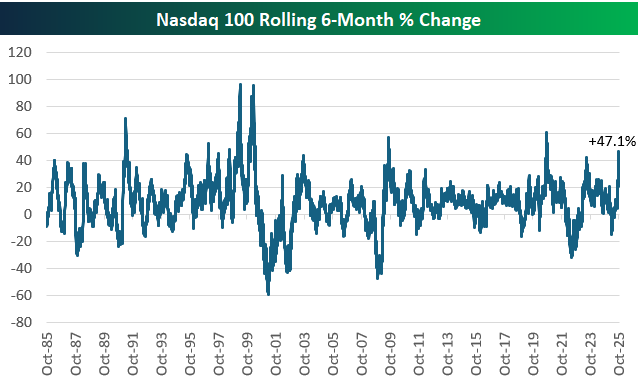
As shown below, the tech-heavy Nasdaq 100 has rallied 47.1% over the last six months. That’s definitely on the high-end for all six-month moves in the index’s history, and it’s the biggest six-month pop since the initial rally back from the COVID Crash back in early 2020.
Amazingly, in the late 1990s during the height of the Dot Com Bubble, we saw two six-month runs of nearly 100% within a year of each other in early 1999 and early 2000.
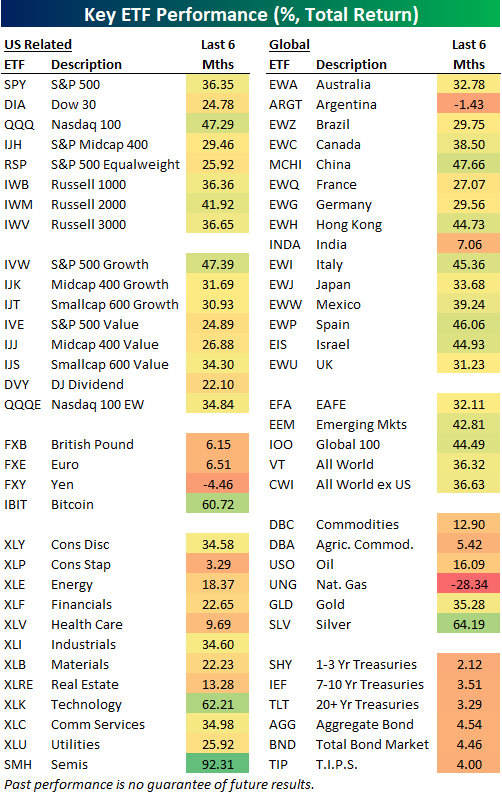
Of the major equity index ETFs in the US, the Nasdaq 100 (QQQ) has rallied the most over the last six months (+47%), while the S&P 500 (SPY) is up 36.4% and the Dow 30 (DIA) is up 24.8%. Small-caps (IWM) have rallied a solid 41.9%, while mid-caps (IJH) are up less at 29.5%.
Looking at the eleven major sector ETFs, Technology (XLK) is the only one that has done better than SPY since the 4/8 low with a gain of 62.2%. Consumer Staples (XLP) and Health Care (XLV) are both up less than 10%. Within the Tech sector, the semis (SMH) are up a remarkable 92.3%; the best performing ETF in our matrix over the last six months.
Outside of the US, plenty of country ETFs have gained 40%+ like China (MCHI), Hong Kong (EWH), Italy (EWI), Spain (EWP), and Israel (EIS). India (INDA) is up just 7.1%, while Argentina (ARGT) has actually fallen 1.4%.
Gold (GLD) has kept right up with equities since 4/8 with a gain of 35.3%. Silver (SLV) is up nearly twice as much with a gain of 64.2%, while the Bitcoin ETF (IBIT) is up 60.7%.
Across Treasury and fixed income ETFs, we’ve seen gains from 2-4.5%.
Bespoke’s Consumer Pulse Report – October 2025
Bespoke’s Consumer Pulse Report is an analysis of a huge consumer survey that we run each month. Our goal with this survey is to track trends across the economic and financial landscape in the US. Using the results from our proprietary monthly survey, we dissect and analyze all of the data and publish the Consumer Pulse Report, which we sell access to on a subscription basis. Sign up for a 30-day free trial to our Bespoke Consumer Pulse subscription service. With a trial, you’ll get coverage of consumer electronics, social media, streaming media, retail, autos, and much more. The report also has numerous proprietary US economic data points that are extremely timely and useful for investors.
We’ve just released our most recent monthly report to Pulse subscribers, and it’s definitely worth the read if you’re curious about the health of the consumer in the current market environment. Start a 30-day free trial for a full breakdown of all of our proprietary Pulse economic indicators.
