Bespoke’s Consumer Pulse Report – December 2025
Bespoke’s Consumer Pulse Report is an analysis of a huge consumer survey that we run each month. Our goal with this survey is to track trends across the economic and financial landscape in the US. Using the results from our proprietary monthly survey, we dissect and analyze all of the data and publish the Consumer Pulse Report, which we sell access to on a subscription basis. Sign up for a 30-day free trial to our Bespoke Consumer Pulse subscription service. With a trial, you’ll get coverage of consumer electronics, social media, streaming media, retail, autos, and much more. The report also has numerous proprietary US economic data points that are extremely timely and useful for investors.
We’ve just released our most recent monthly report to Pulse subscribers, and it’s definitely worth the read if you’re curious about the health of the consumer in the current market environment. Start a 30-day free trial for a full breakdown of all of our proprietary Pulse economic indicators.

Consumer Stocks vs. Consumer Sentiment
While sentiment surveys show that US consumers are not very happy right now (especially boomers), many consumer-related stocks have been telling a different story lately.
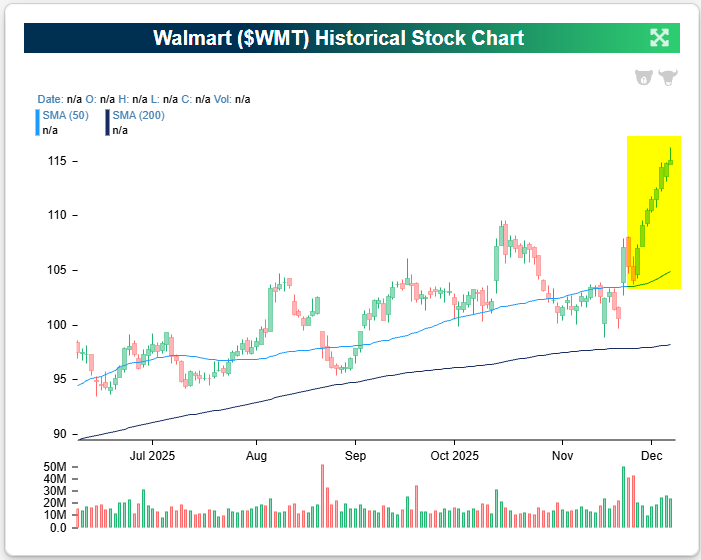
First up is a chart of Walmart (WMT), which has done nothing but trade higher since Thanksgiving:
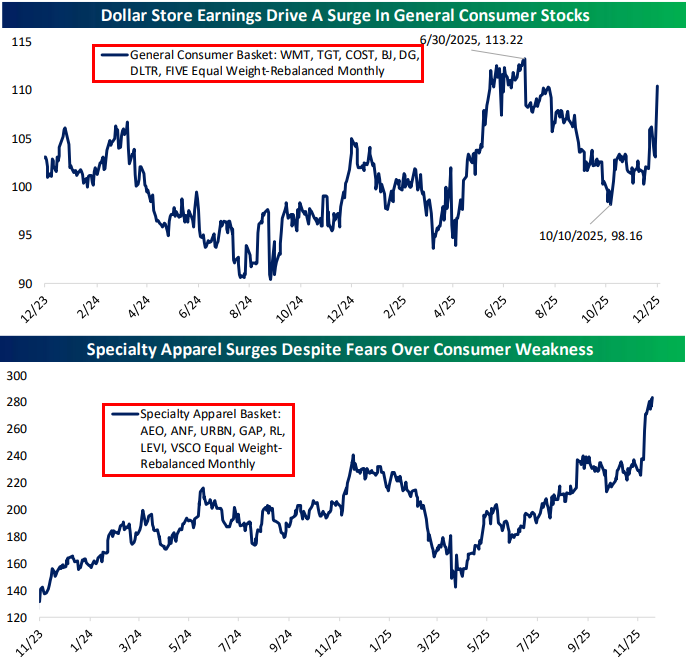
Our equally-weighted basked of general consumer stocks that includes Walmart (WMT), Target (TGT), Costco (COST), BJ’s (BJ), Dollar General (DG), Dollar Tree (DLTR), and Five Below (FIVE) has surged in the last couple of months.
Our specialty apparel basket that has well-known retailers like American Eagle (AEO), Abercrombie (ANF), Gap (GAP), and Levi’s (LEVI) has done even better with a huge jump last week to new highs.
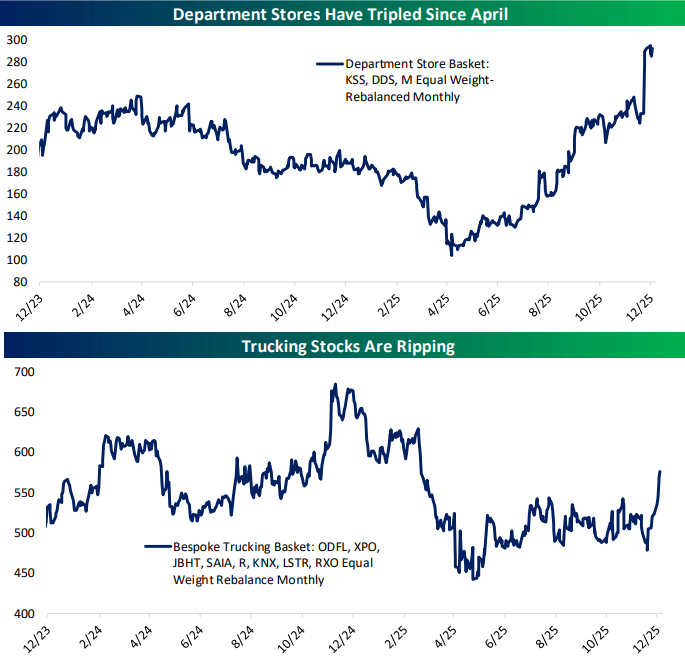
While there are only a few publicly traded department store stocks these days, this basket that includes Kohl’s (KSS), Dillard’s (DDS), and Macy’s (M) has tripled since April. Yes, tripled!
In addition, trucking stocks that deliver goods that ultimately land in the hands of consumers have been ripping over the last month.
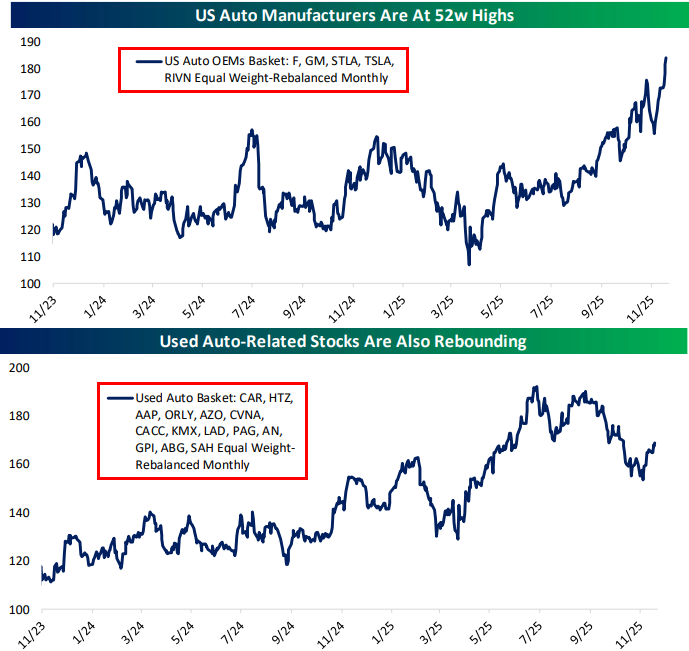
And finally, if the consumer is so weak, we wouldn’t expect to see US auto OEMs and used-car stocks performing as well as they have been lately. Check out the break to new 52-week highs recently in an equally-weighted basket of Ford (F), General Motors (GM), Stellantis (STLA), and Tesla (TSLA).
While our used-car basket isn’t at highs, it remains in an uptrend and has rebounded since the government shutdown ended a few weeks ago.
Not a Bespoke client? We’d love for you to give our equity research platform, Bespoke Premium, a try. You can sign up for complimentary access for 14 days at this link to start receiving our daily emails today!

Chart of the Day: Intraday IBIT Selling
Bitcoin has been whipsawing around $90k for the last week or so. It ended last Friday right around where it’s trading this afternoon, but it’s also down a couple thousand dollars from its highs earlier this morning before the US equity market opened at 9:30 AM ET.
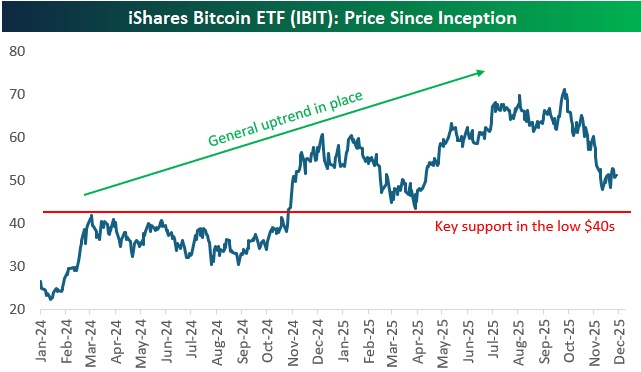
Below is a chart of the iShares Bitcoin ETF (IBIT) since it began trading in January 2024. While IBIT is in a pretty significant drawdown from its all-time high seen in October, its longer trend remains higher. A key support level has formed in the low $40s, and while we have not seen this level get tested during the current drawdown, it would be significant if this support were to break.
While the long-term chart for IBIT doesn’t look bad, the six-month chart looks pretty brutal:
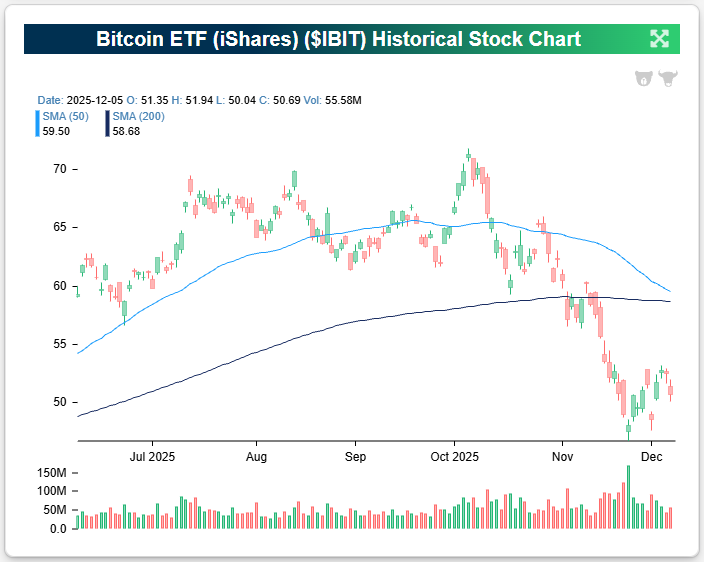
We’ve found what appears to be the problem for IBIT, which trades on US stock exchanges just like other ETFs across asset classes: it trades horribly when the stock market is open.
We looked at IBIT’s action in the six months covered in the chart above to see how it got to its 13.7% decline over this period. Amazingly…
To continue reading the remainder of our latest Chart of the Day, start a 30-day trial to Bespoke Premium or Bespoke Institutional today.
