Mar 2, 2016
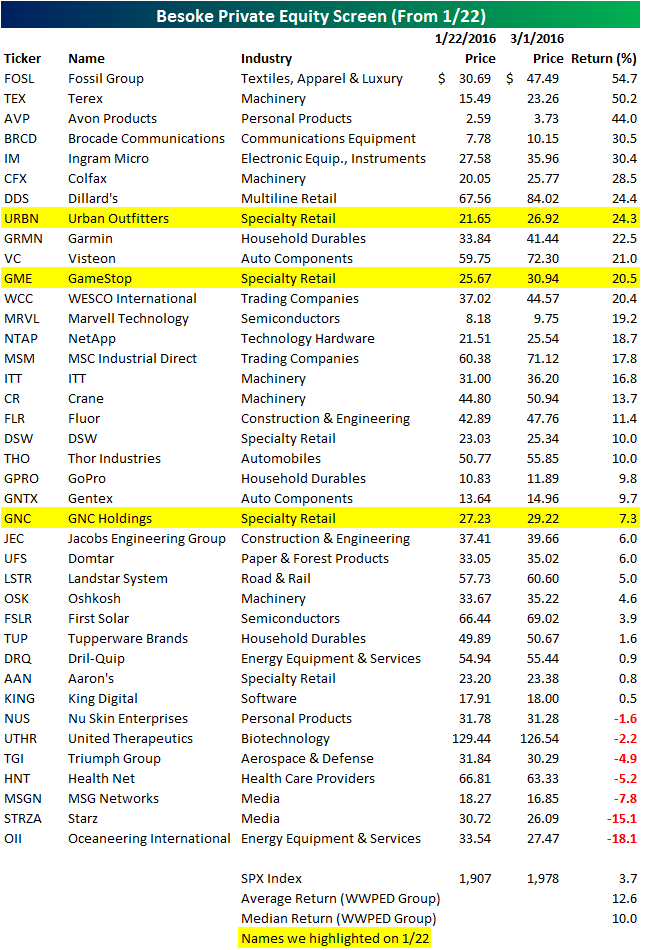
On January 22, we distributed a B.I.G. Tips report to our paid subscribers called, “WWPED (What Would Private Equity Do?” In that report, we looked through the carnage in equity markets to find beaten down, value names that could be attractive targets to the private equity world. We noted that while private equity firms can have widely divergent strategies, they often look for some key characteristics: under-performing companies and significant free cash flow potential. Using that as a guide, we sorted through the Russell 1,000 for companies that were then trading at 10x or less on a “TEV / (EBITDA – Capex)” basis, which is a good proxy for valuation relative to cash flow. We found 39 names that met our criteria and highlighted three in particular (URBN, GNC and GMRE) in that report. It’s no secret that value names have outperformed during the rebound and that beaten down names have outperformed even more so. Even recognizing that, our list of 39 possible targets highlighted in that report has outperformed the broader market handily since then. The “WWPED stocks” are up on average 12.6% since our report, with a median return of 10.0%, while the S&P 500 is up 3.7% over the same time frame.
If you’d like to receive stock ideas like our WWPED list in real time, start a 14 day free trial today. Our Premium and Institutional subscribers receive our B.I.G. Tips reports every day.
Feb 11, 2016
With the ongoing carnage in equity markets through 28 trading days (see our Chart of the Day on this topic with a 14 day free trial), today’s Throwback Thursday (TBT) post looks back to a time when we had more “high class” problems; namely a market that would seemingly only go up. Below is an excerpt of a piece we published in February 2011 looking at what was then a forceful rally that seemed like it might last forever. At the time, we looked to history for similarly strong rallies and found that in the 5 most similar rallies in history, the march upward continued in the next 12 months to the tune of 22% average returns. Nevertheless, that 2011 rally fizzled out and the market was effectively unchanged by February 2012 after a rocky remainder of 2011. So keep your head up: what must end, will end. From that report:
“We’ve heard a lot of comments recently that the market’s levitation since September 1st [2010] is unlike anything ever seen in the equity markets. All the market does is go up! Some say the rally is temporary and the result of the Fed’s fire hose of liquidity. They say that when the Fed turns the faucet off, the party will end. Only time will tell what the market will do going forward, but we were curious to see how common steady upward moves like we’ve seen since September 1st really are, and what they may portend for the market going forward…. As shown in the charts, in all five of the most closely correlated periods to the current one, the S&P 500 saw additional gains over the following 12 months with an average gain of 22.1%!”

Feb 5, 2016
LinkedIn (LNKD) and Tableau Software (DATA) are both down nearly 50% today after reporting earnings. The declines for these two stocks has set off a wave of selling in the social media and software space, and in high P/E growth stocks in general.
Below we have broken up the S&P 500 into deciles (10 groups of 50 stocks each) based on P/E ratios. The 50 stocks in the index with the lowest P/E ratios are in decile 1 on the left side of the chart. The 50 stocks with the highest (or no) P/E ratios are in decile 10 on the right side of the chart.
The numbers shown for each decile represent the average one-day percentage change today for its 50 stocks. As shown, the five deciles containing the stocks with the lowest P/E ratios are down an average of 0.7% to 1.1% today. The bottom five deciles that contain stocks with the highest P/E ratios are all down much more. The 50 stocks with the highest P/E ratios in the S&P 500 are averaging a decline of 3.1%.
Investors appear to be much less willing to pay up for growth today than they were yesterday. This looks like a case of “valuations don’t matter…until they do.”

Feb 5, 2016
Given the overall tone of the market since the start of the year, you may be surprised to read that the average stock that has reported earnings this season (which began in early January) has gained about 0.35% on its earnings reaction day (the first trading day after its report).
We keep a huge database of every single earnings report from almost every single U.S. stock from every single earnings season going back to 2001. (Bespoke Institutional members have full access to the database.) From this list we can monitor the best and worst performers each earnings season.
Below is a list of the stocks that have gained the most on their earnings reaction days so far this season. Each of these stocks gained at least 15% on the first trading day following their report. As shown, TimkenSteel (TMST) has been the biggest winner with a huge gain of 74.95% on its earnings reaction day last Friday. SunCoke Energy (SXC) ranks second with a gain of 52.61%, followed by Multi-Fineline (MFLX), Boot Barn Holdings (BOOT), Glu Mobile (GLUU), Roadrunner Transportation (RRTS), and Cascade Microtech (CSCD) — which all gained more than 30%.
Five S&P 500 stocks are on the list of earnings season winners — Michael Kors (KORS), Under Armour (UA), CONSOL Energy (CNX), Kinder Morgan (KMI), and Facebook (FB).

While 42 stocks that have reported this season have gained more than 15% on their earnings reaction days, 49 stocks have fallen more than 15%. These 49 losers are listed below.
Tableau Software (DATA) and LinkedIn (LNKD) both reported last night after the close, and they’re both down huge today — 49.85% for DATA and 39.45% for LNKD. These two stocks have been the worst performers on their earnings reaction days so far this season. Four other stocks have fallen more than 30% — Esterline Techs (ESL), OSI Systems (OSIS), YRC Worldwide (YRCW), and Silicon Graphics (SGI). As you can see, four of the five worst performing stocks on earnings this season reported last night after the close.
Six S&P 500 stocks are on the list of biggest earnings season losers — Ralph Lauren (RL), Alliance Data (ADS), United Rentals (URI), ADT, Juniper (JNPR), and Royal Caribbean (RCL).
For more earnings season analysis, we’ll have a detailed update in our weekly Bespoke Report newsletter due out later today. Choose one of our three membership options to receive it in your inbox upon publication!
