Bespoke’s Mid-Year 2026 Investor Sentiment Report
In mid-December 2025, we sent Bespoke’s client base a survey to capture the current thinking of experienced investors on markets, the economy, policy shifts, and portfolio positioning heading into 2026 and beyond.
As a follow-up to our year-end survey, we sent clients our Mid-Year 2026 Investor Survey in the last two weeks of June.
You can read Bespoke’s Mid-Year 2026 Investor Sentiment report by signing up for any of our three membership levels below. Enter the coupon code “OUTLOOK” at checkout for a 20% discount on your first charge. You can review our membership levels here to help make your decision.
Bespoke Newsletter Monthly Payment Plan
Bespoke Newsletter Annual Payment Plan
Bespoke Premium Monthly Payment Plan
Bespoke Premium Annual Payment Plan
Bespoke All Access (Bespoke Institutional) Monthly Payment Plan
Bespoke All Access (Bespoke Institutional Annual Payment Plan
Matrix of Economic Indicators – 7/6/26
Our Matrix of Economic Indicators provides a concise summary analysis of the US economy’s momentum. We combine trends across the dozens and dozens of economic indicators in various categories like manufacturing, employment, housing, the consumer, and inflation to provide a directional overview of the economy.
To access our newest Matrix of Economic Indicators, start a two-week free trial to either Bespoke Premium or Bespoke Institutional now!
Bespoke’s Morning Lineup – 7/6/26 – Falling SOX
See what’s driving market performance around the world in today’s Morning Lineup. Bespoke’s Morning Lineup is the best way to start your trading day. Read it now by starting a two-week trial to Bespoke Premium. CLICK HERE to learn more and start your trial.
“Philosophy is common sense with big words.” – James Madison

Below is a snippet of commentary from today’s Morning Lineup. Start a two-week trial to Bespoke Premium to view the full report.
US futures are coming back from the holiday weekend full of life, with the S&P 500 poised to gap up 0.5% at the open while the Nasdaq rallies more than 1%. Treasury yields are lower, with the 10-year yield moving down to 4.46%. Crude oil prices have seen little movement, with WTI trading right below $69 per barrel, and gold is rallying 1% to $4,167 per ounce. In crypto, Bitcoin is down over 1% and below $62K.
Asian markets kicked off the new week on a quiet note, with Hong Kong (+1.1%) the only benchmark to move up or down by more than 1%. The Nikkei declined 0.1% while South Korea declined 0.5%. China’s Shanghai Composite was also down 0.1%.
The tone for European stocks is similarly muted, but more skewed to the downside. The STOXX 600 is trading down 0.3% in early trading. Spanish stocks are leading the losses, down 0.8%, while French stocks are unchanged. Retail sales and PPI for the region both rose 0.2% in May and were both right in line with expectations.
The only data on the calendar today are Service sector PMIs from S&P and ISM, and the earnings calendar is blank with no real notable reports until Thursday when Pepsi reports before the open.
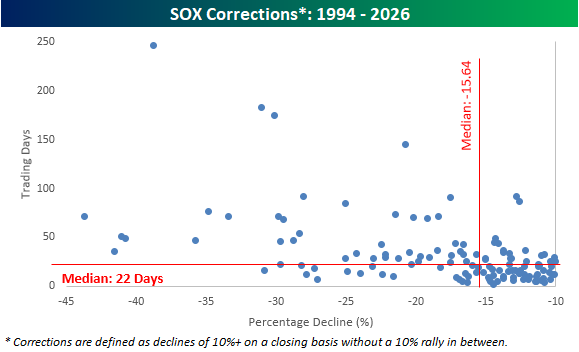
Semiconductor stocks really limped into the holiday weekend as the Philadelphia Semiconductor Index (SOX) fell 5.4% on Thursday following a 6%+ decline on Wednesday. That was the first back-to-back 5%+ declines in the index since April 2025. Those two declines alone were enough to put the SOX into correction territory, but with the index already off its highs heading into Wednesday’s session, it is now down 13.7% from its recent closing high. This current correction for the index comes less than a month after another 12.3% correction that ended in early June. Volatility in the SOX is clearly picking up.
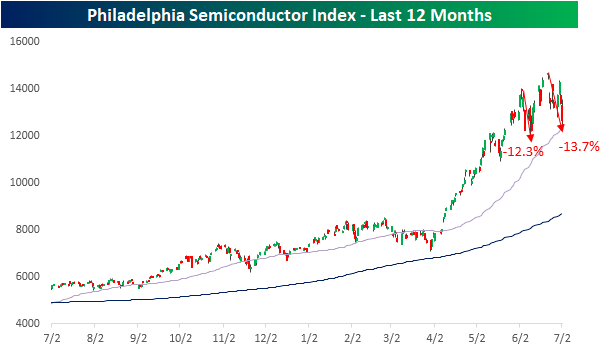
The chart below shows all 127 SOX corrections since its inception in 1994 in terms of time and price. Overall, the median correction has lasted 22 days (current correction has been 10 days) and experienced a peak-to-trough decline of 15.64%. So, the current period is less than halfway there in terms of time, but not far from the median in terms of price.
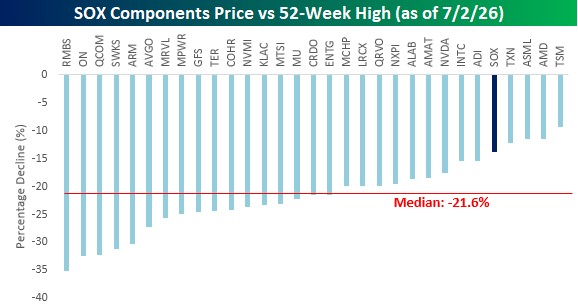
While the SOX itself is down nearly 14%, the individual stocks that make up the index have seen larger declines relative to their respective peaks. Only four of the index’s 30 components are currently in drawdowns of less than 15%, and the median decline has been 21.6%. The biggest losses have been in the shares of Rambus (RMBS), ON Semiconductor (ON), Qualcomm (QCOM), Skyworks (SWKS), and Arm Holdings (ARM), all of which are down over 30%. Nvidia (NVDA), the largest of the stocks in the index, has been a big underperformer on the way up, but on the way down, it hasn’t been quite as extreme as its current drawdown of 17.6% is four percentage points less than the median of the index’s 30 components.
Start a two-week trial to Bespoke Premium to continue reading today’s full Morning Lineup.
Brunch Reads – 7/5/26
Welcome to Bespoke Brunch Reads — a linkfest of some of our favorite articles over the past week. The links are mostly market-related, but there are some other interesting subjects covered as well. We hope you enjoy the food for thought as a supplement to the research we provide you during the week.
One Sheep, Two Sheep: On July 5, 1996,
a lamb was born at the Roslin Institute near Edinburgh, Scotland, as part of an effort to determine whether an adult cell could be used to create an entire animal. Scientists hoped the work could eventually help produce livestock with desirable traits and support medical research by making genetically identical animals. To create the lamb, they removed the nucleus from an unfertilized egg and replaced it with genetic material taken from a mammary gland cell belonging to an adult Finn Dorset sheep. The reconstructed embryo was then implanted into a surrogate mother.
The birth itself appeared ordinary. The lamb, later named Dolly, was delivered normally and initially looked like any other healthy sheep. What made her extraordinary was discovered through genetic testing: she carried the nuclear DNA of the adult sheep that had supplied the mammary cell, making her the first mammal cloned from a mature body cell. The result proved that an adult cell still contained all the genetic instructions needed to produce a complete organism, even after the cell had specialized for a particular function.
Dolly’s creation opened new possibilities in biology, agriculture, and medicine, including cloning valuable animals, preserving endangered species, and creating genetically matched animals for research. It also presented difficulties around animal welfare, genetic diversity, and the possibility of human cloning. Although Dolly was the only successful birth from hundreds of reconstructed embryos, the experiment changed scientists’ understanding of how flexible adult cells could be and helped pave the way for later advances in stem-cell research and regenerative medicine.

Economic Trends
Mexico in U.S. Supply Chains: Lessons from 2018-19 Tariffs (Federal Reserve)
US tariffs on China helped redirect production toward Mexico, which has overtaken China as America’s largest source of imports, but most of Mexico’s gains came from Mexican firms and other foreign manufacturers rather than from goods simply routed through the country. Chinese-linked production in Mexico accounted for an estimated 14% of the increase, while direct transshipment was negligible, suggesting tariffs are changing where goods are made more than encouraging simple tariff evasion. [Link]
Continue reading our weekly Brunch Reads linkfest by logging in if you’re already a member or signing up for a trial to one of our two membership levels shown below! You can cancel at any time.

The Closer – Curve Flattener, Jobs Day, Data Center Shadows – 7/2/26
Log-in here if you’re a member with access to the Closer.
- Germany’s DAX surged close to 2% today to finish with a fresh all-time high.
- Weekly jobless claims data continues to show a robust labor market although jobs growth according to the Nonfarm Payrolls report decelerated.
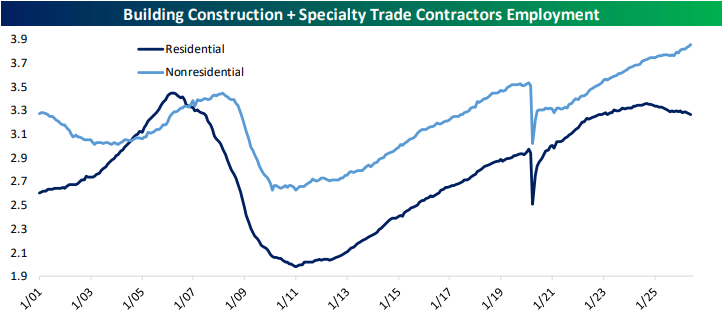
- The massive increase in construction labor demand from data centers is serving a useful purpose: masking the slowdown in housing activity.
See today’s full post-market Closer and everything else Bespoke publishes by starting a 14-day trial to Bespoke Institutional today!
“Yes, Sir!”
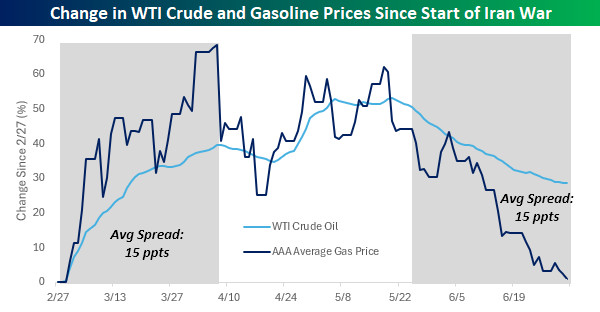
President Trump took to the Truth Social machine earlier this week to air his frustration with the petroleum industry when he demanded that “Gasoline Retailers must get their Prices down, IMMEDIATELY!”
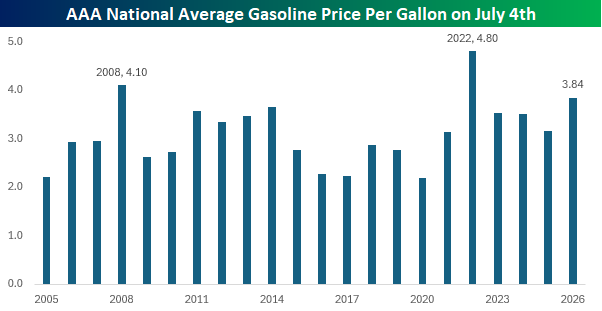
A look at where prices stand now relative to July 4th in prior years shows that the current AAA national average price for a gallon of gas is the third highest of any year since at least 2005. The only two years when prices were higher were in 2008 ($4.10) and 2022 ($4.80). Besides the high level of prices, this year’s 35.5% YTD gain also ranks as the fourth-largest YTD increase since 2005.
Higher gas prices are one area where inflation is most noticed by the consumer, so having these price levels heading into midterms is not what anyone in office wants to see. We can certainly understand the President’s frustration, but does he have a point?
The chart below compares the change in crude oil and gasoline prices since the start of the war in late February. As of this morning, WTI crude oil prices have essentially round-tripped the gains they saw early on in the war. The same can’t be said for prices at the pump, though, as they’re still up 29% since 2/27. While crude oil prices have fallen rapidly, gas prices have been much slower to respond.
If crude oil prices remain at these levels, prices at the pump will follow. In addition to the positive correlation to oil prices, average gas prices also have a consistent seasonal tendency to decline in the second half of the year.
Are gas prices artificially high, though? Not necessarily. While they’ve been much slower to follow crude oil prices lower in the last few weeks, gas prices were also slower to respond to the rise in crude oil prices. For example, in the six weeks leading up to the peak in crude oil prices on 4/7, the average spread between the percentage gain in crude oil prices versus the increase in gas prices was 15 percentage points. Conversely, in the six weeks leading up to today, the average percentage spread between the two was also 15 percentage points but in the opposite direction.
Gas stations are an easy target when crude oil prices fall, but looking at the pattern between the two since the war started shows that they are probably just working through the same lag that cushioned the blow for consumers on the way up. With crude back to pre-war levels, a meaningful drop in prices at the pump won’t just be a reaction to the President’s demand, but the natural, lagged result of the fall in crude oil prices.
Want more from Bespoke? You can start by joining our Think BIG mailing list, where you’ll receive an interesting market stat in your inbox a few times per week. All we need is your email address. Join now by clicking here or on the image below.

Bespoke’s Morning Lineup – 7/2/26 – Happy 250th
See what’s driving market performance around the world in today’s Morning Lineup. Bespoke’s Morning Lineup is the best way to start your trading day. Read it now by starting a two-week trial to Bespoke Premium. CLICK HERE to learn more and start your trial.
“Philosophy is common sense with big words.” – James Madison
Below is a snippet of commentary from today’s Morning Lineup. Start a two-week trial to Bespoke Premium to view the full report.
After a shaky start to the third quarter yesterday, equity futures remained wary ahead of the June Non-Farm Payrolls report, with the S&P 500 basically unchanged while the Nasdaq was up less than 10 basis points. Treasury yields are slightly higher, but the 10-year yield is back above 4.5%. The real story, though, is in the energy market, where WTI prices are down over 2% and back to where they traded before the war with Iran started. Gold prices are down fractionally, and Bitcoin is higher, trading back above $61K.
In Asia, it was a shaky night led lower by tech stocks as South Korea plunged nearly 8%, the Nikkei fell 2.5%, and China dropped 2%. That’s not the start of a quarter bulls would have hoped for, but it’s also not unexpected given the moves higher we saw in Q2.
In Europe, stocks are broadly higher with the STOXX 600 trading up over 0.5%, as Italy and Spain lead the way, gaining over 1%.
It’s a busy day for economic data as we pack a lot of reports into the day due to Friday’s holiday. The main report, though, was the Non-Farm Payrolls report, which came in weaker than expected. The initial read was 57K, or about half expectations. Despite the weaker print, the Unemployment Rate dropped to 4.2% versus forecasts for 4.3%. Also, Initial and Continuing Claims were both slightly lower than expected. So, the headline number may have been weaker than expected; other releases weren’t nearly as bad. When it comes to the Non-Farm Payrolls, the most important thing to remember is that the initial release is what you tell your wife you’re going to spend at Costco, and the revision is your credit card statement. They’re rarely the same!
As we kick off the second half, investors face no shortage of questions. Will earnings season live up to expectations? Will inflation cool? Will the ceasefire in the Middle East continue? Will the AI trade continue to keep the market afloat, or will the underperformance of mega-caps sink the rally? We can all take our best guesses at these questions, but only time will tell, and as events unfold, the market will continue to react with gains and losses.
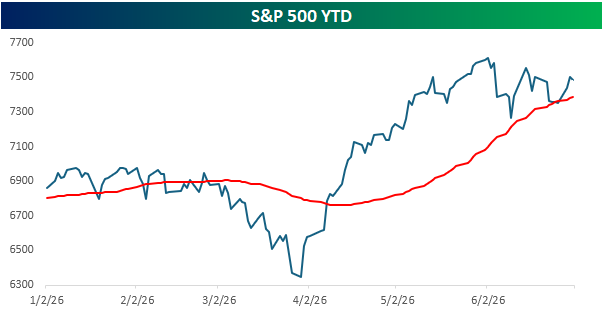
After a blistering rally off the March lows, investors are starting to question their recent optimism, which has caused the advance to stall. Heading into the last trading session before the July 4th holiday, the S&P 500 sits just above its 50-day moving average, so even on a short-term basis, the rally remains in place despite the sawtooth action of the last six weeks.
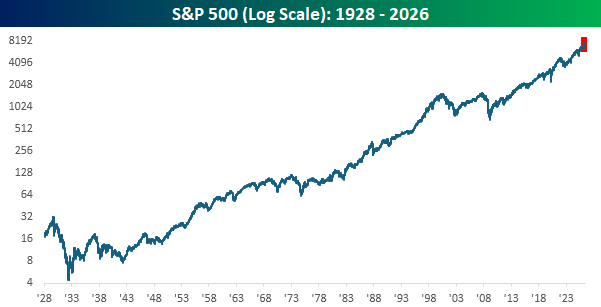
Regardless of how the market responds to these short-term questions, the most important thing to keep in mind is that over the last 250 years (to the day Saturday!), there has been no better investment than the US economy. The chart below goes back nearly a century, and the trend has been clear. It hasn’t been a straight line higher, but the last six months (red box) look inconsequential, and even the dark days of the Great Depression and the unwinding of the 1990s tech bubble don’t seem that bad. Most importantly, though, we got through them.
In real time, the road ahead won’t be smooth, but time has a way of smoothing out the rough edges, and $1 invested in the S&P 500 in 1928 would be worth more than $10,000 today. So, let’s all celebrate this weekend what makes this country the greatest place on earth and get back to work next week in the pursuit of making that $10,000 worth $100,000,000 by 2126! Happy 250th, everyone!
Start a two-week trial to Bespoke Premium to continue reading today’s full Morning Lineup.
The Closer – Momentum Mess, Drawdown, Job Postings – 7/1/26
Log-in here if you’re a member with access to the Closer.
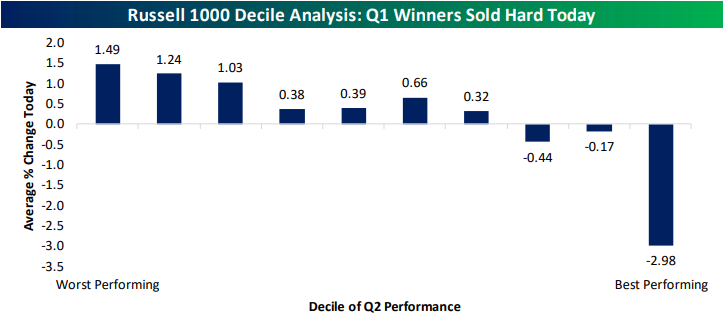
- With massive rotation today, the best-performing decile of Russell 1,000 stocks from last quarter collapsed 2.98% while the bottom three deciles were all up over 1%.
- Crude oil inventories have reached multi-decade lows and when excluding strategic reserves, inventories are at the lowest levels since 2018.
- Job postings data from Indeed has recently diverged from the recent move high in JOLTS job openings.
See today’s full post-market Closer and everything else Bespoke publishes by starting a 14-day trial to Bespoke Institutional today!
Q2 2026 Earnings Conference Call Recaps: FactSet (FDS)
Bespoke’s Conference Call Recaps use AI to summarize lengthy earnings calls. The commentary below is AI-generated and then edited by Bespoke for quality control. As always, none of these summaries should be construed as recommendations to buy or sell any securities, and investors should do their own research and/or consult with a financial professional before making any investment decisions.
Our latest recap available to Bespoke subscribers covers FactSet’s (FDS) Q3 2026 earnings call.
![]()
FactSet (FDS) sells financial data, research tools, and portfolio software to asset managers, banks, and other large financial institutions. Its platform reaches nearly 250,000 users and serves 95 of the top 100 asset managers and more than 85% of the top 50 global investment banks, giving investors insight into institutional spending, market-data demand, financial-industry technology adoption, and the changing way investment professionals work. FactSet’s growth picked up again, with annual subscription value (ASV) rising 7.1% to $2.48 billion across every region and customer group. AI is becoming a measurable driver of sales as more than 10% of the quarter’s growth came directly from AI products, and clients using FactSet’s AI tools are growing their spending faster than the rest of the customer base. Demand for its MCP data connections also jumped, with usage reaching 13 times the prior quarter’s level. The company is also moving customers away from simple per-user licenses and into broader, longer-term contracts that cover more data and services. In reaction to better-than-expected results, shares of FDS rose more than 5% on 7/1…
Continue reading our Conference Call Recap for FDS by becoming a Bespoke Institutional subscriber. You can sign up for Bespoke Institutional now and receive a 14-day trial to read our newest Conference Call Recap. To sign up, choose either the monthly or annual checkout link below:
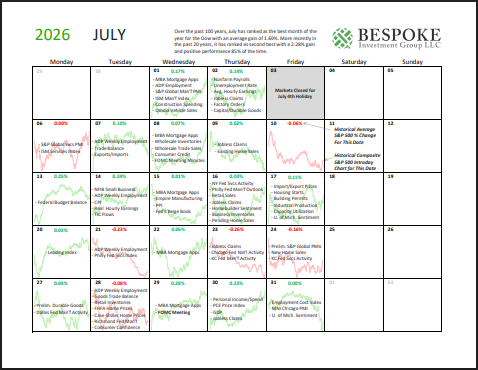
Bespoke Market Calendar — July 2026
Please click the image below to view our July 2026 market calendar. This calendar includes the S&P 500’s historical average percentage change and average intraday chart pattern for each trading day during the upcoming month. It also includes market holidays and options expiration dates plus the dates of key economic indicator releases.Click here to view Bespoke’s premium membership options.