See what’s driving market performance around the world in today’s Morning Lineup. Bespoke’s Morning Lineup is the best way to start your trading day. Read it now by starting a two-week trial to Bespoke Premium. CLICK HERE to learn more and start your trial.
“We should keep on going along the path of globalization. Globalization is good… when trade stops, war comes.” – Jack Ma

Below is a snippet of commentary from today’s Morning Lineup. Start a two-week trial to Bespoke Premium to view the full report.
Paul Hickey appeared on CNBC’s Squawk on the Street on Tuesday to discuss markets, semis, and inflation. To view the segment, click on the image below.
It’s hard to call yesterday’s decline (-0.16% in the S&P 500 and -0.71% in the Nasdaq) a dip, but investors have stepped in to buy it this morning as both the S&P 500 and Nasdaq are poised to erase yesterday’s losses at the open. Treasury yields are little changed, crude oil is fractionally lower, gold is higher, and Bitcoin is modestly lower but still above $80K.
The positive tone in US futures follows an up night in Asia as the Nikkei rallied 0.8% and South Korea jumped 2.6%. Chinese stocks are up 0.7% as Air Force One is touching down in Beijing as we type this.
In Europe, the tone is mixed with the STOXX 600 up 0.3% as Germany leads (+0.6%) and France and Spain decline fractionally. GDP in the Eurozone increased 0.1%, which was inline with expectations, while employment increased slightly more than expected, although French unemployment unexpectedly increased from 7.9% up to 8.1%.
The only economic report on the calendar this morning was April PPI, and boy, was it a clunker. Headline PPI surged 1.4% – not y/y but m/m while the core reading surged 1.0% versus estimates for an increase of just 0.3%. The headline index was only forecast to increase 0.5%. PPI tends to be more volatile than CPI, but these numbers are hot, hot, hot. As you would expect, the immediate response in the futures market was for yields to spike higher while equities erased half of their pre-release gains.
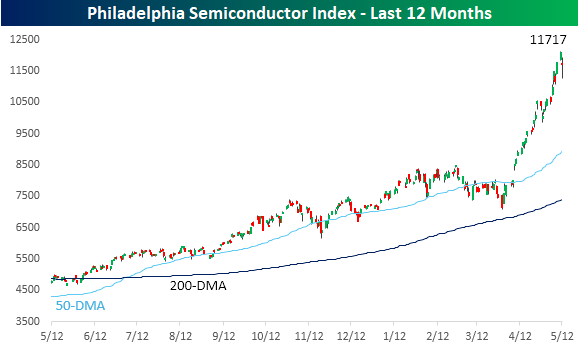
It was bound to happen at some point. After seemingly going up every day lately, the Philadelphia Semiconductor Index (SOX) declined just over 3% yesterday after falling as much as 6.7% on an intraday basis. Even for semis, swings and declines of that magnitude are notable, but looking at the chart, you can barely see them. Even after that drop, the SOX is still 31% above its 50-day moving average.
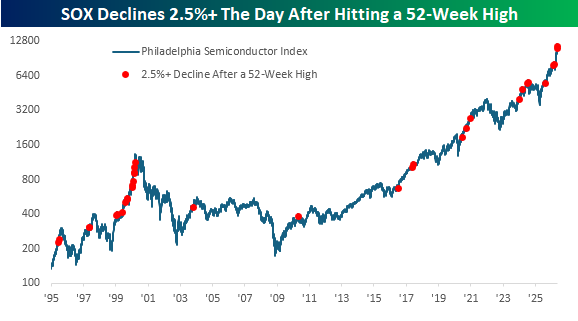
We were curious to see how common it is for the SOX to fall more than 2.5% just one day after closing at an all-time high. Since 1995, it’s happened 23 other times. You know when the last occurrence was? Last Thursday! It was also the fourth occurrence this year.
The chart below shows each prior occurrence with a red dot. While there were certainly other occurrences spread sporadically over the years, the only other time they were as frequent as the last five years were during the mid-1990s, right up to the 2000 peak. That’s a parallel that has come up a lot lately, with the trillion-dollar question being where we are in that comparison – 1998 or early 2000.
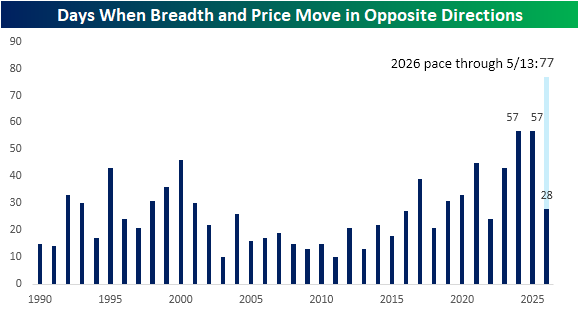
We’ve discussed the lack of strong market breadth on up days several times in recent weeks, but yesterday we saw the opposite as the S&P 500 declined even as its net advance/decline line was positive. That divergence marked the third straight day and the 28th time this year that price and breadth moved in opposite directions.
The chart below shows the frequency of days by year when price and breadth diverged. Over the last ten years, we’ve seen a steady increase in the number of occurrences, and in both 2024 and 2025, the S&P 500 saw a record number of divergent days. As mentioned above, we’ve already seen 28 occurrences this year. If that pace continues, this year’s total would spike up to 77, far eclipsing the records of the prior two years.
Start a two-week trial to Bespoke Premium to continue reading today’s full Morning Lineup.
