See what’s driving market performance around the world in today’s Morning Lineup. Bespoke’s Morning Lineup is the best way to start your trading day. Read it now by starting a two-week trial to Bespoke Premium. CLICK HERE to learn more and start your trial.
“If The Headline Is Big Enough, It Makes The News Big Enough.” – Citizen Kane

Below is a snippet of commentary from today’s Morning Lineup. Start a two-week trial to Bespoke Premium to view the full report.
Equity futures are slightly higher this morning as investors look to breathe a sigh of relief after a wild couple of weeks. Besides the massive gains in April, the massive deluge of earnings reports this week in terms of both quantity and market cap had the potential to create waves. But we got through it just about as well as you could ask for, as none of the major mega-caps blew up and Wednesday’s Fed meeting was a non-event despite all the pearl-clutching over the number of dissents regarding, not the policy decision, but the phrasing of forward guidance. The media needs something to talk about, though!
The bigger question is, with the most consequential earnings reports and Powell’s last meeting as Fed Chair behind us, what will be the next catalyst? Iran again? That may be the case, though, as just now reports are crossing the tape that Iran has sent a new proposal to Pakistan.
Treasury yields are slightly lower in the US this morning, with the 10-year yield at 4.38%, crude oil is slightly lower, gold is down nearly 1%, and Bitcoin is up 1.5%. International markets are mostly closed this morning in observance of the May Day holiday, but Japan and the UK were both open, and the former saw a modest gain while the UK is down about 0.6%
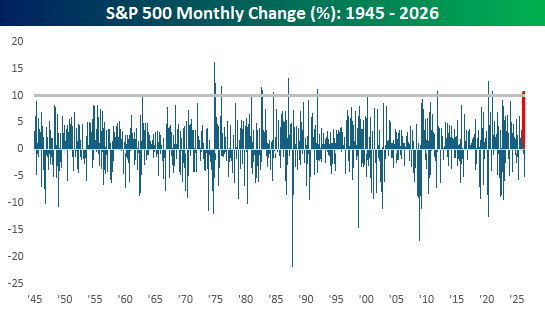
The S&P 500 rallied 10.43% in April, marking the largest monthly gain for the index since November 2020 and the 14th month since WWII that the S&P 500 had a monthly gain of more than 10%. While moves of this magnitude were rare in the immediate years after WWII, they have been somewhat more frequent, but still uncommon, in recent decades.
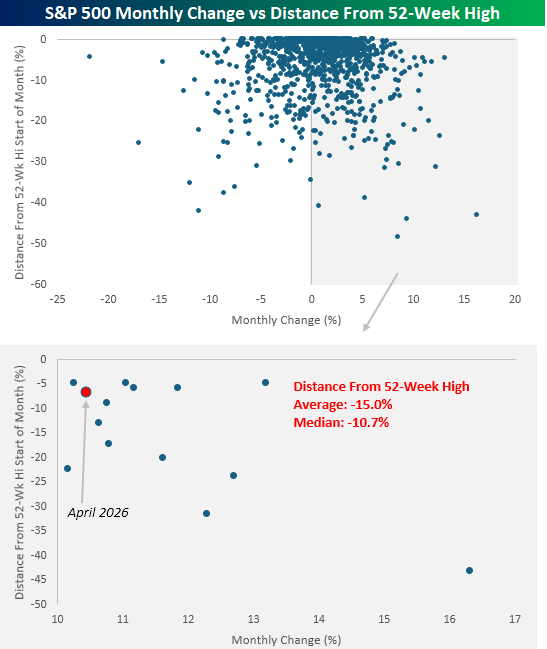
The scatter chart below compares the S&P 500’s monthly change since 1945 to where it was trading relative to a 52-week high at the start of each month. Below that, we have zoomed in on the months that had double-digit percentage gains. At the start of this April, the S&P 500 was just over 6% below its 52-week high, and while that wasn’t the closest the index was trading to a high at the start of a double-digit percentage month, it was close. For all months with double-digit gains, the S&P 500 was trading an average of 15.0% (median: -10.7%) from a 52-week high at the start of the month.
Start a two-week trial to Bespoke Premium to continue reading today’s full Morning Lineup.
