See what’s driving market performance around the world in today’s Morning Lineup. Bespoke’s Morning Lineup is the best way to start your trading day. Read it now by starting a two-week trial to Bespoke Premium. CLICK HERE to learn more and start your trial.
“The circumstances of the world are so variable that an irrevocable purpose or opinion is almost synonymous with a foolish one.” William H. Seward

Below is a snippet of commentary from today’s Morning Lineup. Start a two-week trial to Bespoke Premium to view the full report.
After a rough finish to the week for bulls last Thursday and Friday, futures are looking to rally this morning after the President posted that “The United States of America is in serious discussions with A NEW, AND MORE REASONABLE, REGIME to end our Military Operations in Iran. Great progress has been made.”
As optimistic as those statements are, the President has made a habit of making positive early-week comments to try and soothe the market. It’s become so predictable that the Speaker of Iran’s Parliament posted on X last night that “ Pre-market so-called “news” or “Truth” is often just a setup for profit-taking. Basically, it’s a reverse indicator. Do the opposite: If they pump it, short it. If they dump it, go long.” So that’s where we are now.
Regardless of the investment advice from Iran, futures remain positive with the S&P 500 and Nasdaq both indicated to open up 0.6%, even as crude oil is higher (but off the overnight peak). Treasury yields are also sharply lower as the 10-year yield dips down to 4.37% from 4.44% last Friday. Gold prices are also 1.4% higher, and both moves could be taken as a sign that investors are becoming more aware of potential recessionary risks if the war drags on.
In economic data today, the Dallas Fed Manufacturing is the only report on the calendar, and economists expect a modest rebound from last month’s modestly positive report.
US futures may be higher this morning, but it was a rough night in Asia, with the only green shoot being China, where the Shanghai Composite eked out a 0.2% gain. Other indices in the region were all down roughly 1% or more, with the steepest declines coming in South Korea (-3.0%) and Japan (-2.8%). The yen briefly slumped to its lowest level versus the dollar in nearly two years, but rebounded to finish off its lows of the day after BoJ officials hinted that intervention could be on the way.
European equities are in a more jovial mood this morning as the STOXX 600 trades up 0.4% in the early going, while the FTSE 100 leads the region with a gain of 0.9%, but the rally has been broad with every major benchmark in positive territory, at least for now.
The S&P 500 traded down another 2.1% last week, extending its weekly losing streak to five and taking the total decline over this period to 7.8%. After breaking below its 200-day moving average the week before last, the intensity of selling picked up steam last week, taking the S&P 500 down to the lowest level since August 7. For anyone who argued that the market had gotten ahead of itself and needed a rest late last year, you got what you wanted. Despite all the weakness, though, the S&P 500 is still more than 30% above its intraday tariff-tantrum low from last April.
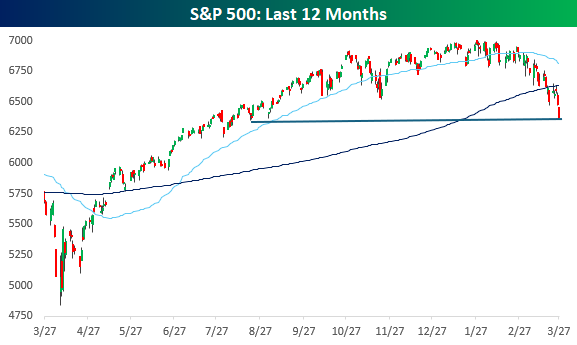
The current five-week losing streak in the S&P 500 ranks as the first such streak for the index in nearly four years (May 2022) and the 30th such streak since 1953, when the five-day trading week in its current form started in late 1952. With a decline of 7.8% during the last five weeks, the current decline has been less than the average of 8.4% for all streaks since 1952. The deepest decline was 17.5% in June 1962, while the mildest was in July 2004 when the S&P 500 declined just 3.1%.
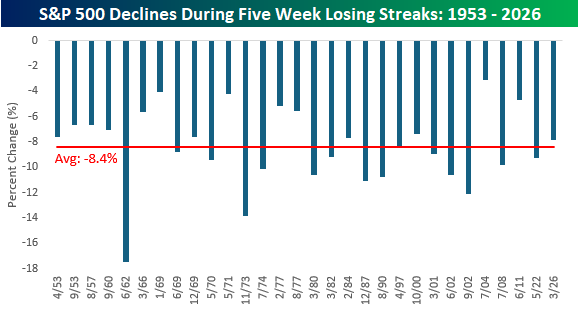
The long-term chart of the S&P 500 below shows when each prior streak occurred with a red dot. It’s interesting to see in the chart how these streaks were relatively common for much of the period from the early 1950s up through the Financial Crisis. Since the end of 2008, though, there have only been two other streaks in the last 17 years. Finally, in terms of whether these types of streaks represent buying opportunities or not, a look at the chart shows an inconclusive picture. Some of these streaks marked short-term lows for the market, but several others occurred right in the middle of longer-term downtrends.

