Apr 25, 2017
The top five performers in our ETF universe over the last five days are all European equity funds, with returns ranging from 6.3 to 7.6%. Turkey and steel producers are the only ETFs in the top ten not related to European stocks. Banks, Transports, and some EM names round out the top 20. Coffee is the worst performer in our bottom 20, again, while gold miners, oil, energy, and broad commodities data are all weak as well.

Bespoke provides Bespoke Premium and Bespoke Institutional members with a daily ETF Trends report that highlights proprietary trend and timing scores for more than 200 widely followed ETFs across all asset classes. If you’re an ETF investor, this daily report is perfect. Sign up below to access today’s ETF Trends report.
See Bespoke’s full daily ETF Trends report by starting a no-obligation free trial to our premium research. Click here to sign up with just your name and email address.
Apr 25, 2017
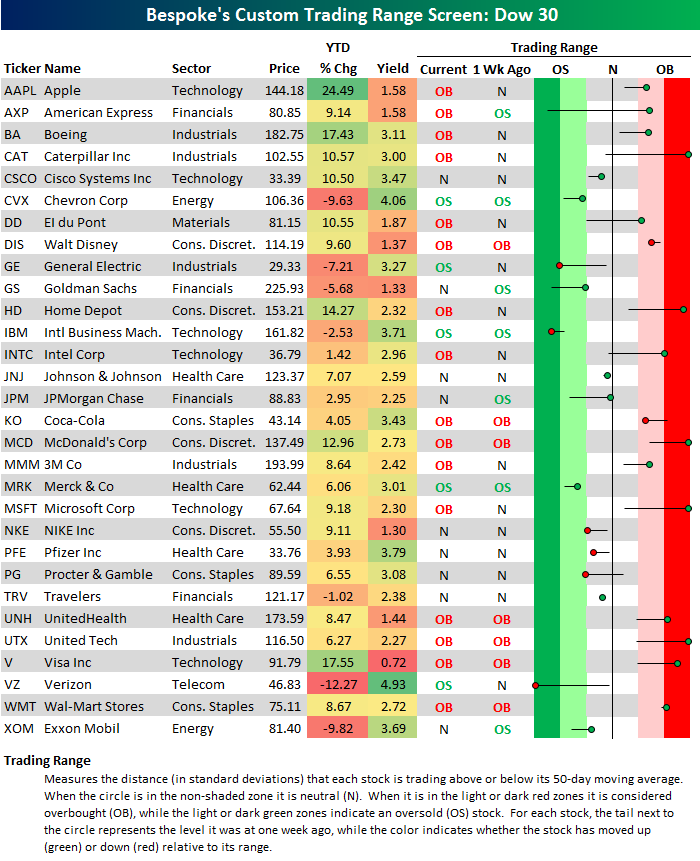
Two days of big gains for the market plus positive reactions to earnings reports has pushed a number of Dow 30 stocks into extreme overbought territory. Below is our trading range screen for the 30 Dow stocks which highlights overbought/oversold levels. As shown, Caterpillar (CAT), Home Depot (HD), McDonald’s (MCD), Microsoft (MSFT), United Tech (UTX), and Visa (V) are all trading at extreme overbought levels, which means they’re more than two standard deviations above their 50-day moving averages. CAT, MCD, MSFT, and UTX are trading three standard deviations above their 50-days. Three standard deviations is quite extended for a mega-cap blue-chip name.
On the flip side, there are five Dow stocks that are currently oversold. Verizon (VZ) is at the most extreme level, trading 3 standard deviations below its 50-day.
Apr 24, 2017
Log-in here if you’re a member with access to the Closer.
Looking for deeper insight on global markets and economics? In tonight’s Closer sent to Bespoke Institutional clients, we take a look at what a cut in the corporate tax rate would mean in practice relative to the size of the economy and the current deficit. We also take a look back at the impact the last government shutdown had on economic data.

The Closer is one of our most popular reports, and you can sign up for a free trial below to see it!
The Closer is one of our most popular reports, and you can see it and everything else Bespoke publishes by starting a no-obligation 14-day free trial to our research!
Apr 24, 2017
Start a 14-day free trial to see Bespoke’s best and most actionable research.
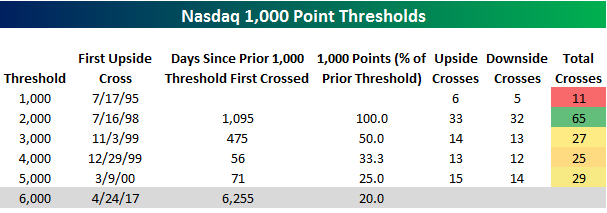
The Nasdaq Composite index is quickly closing in on a major milestone, the likes of which it hasn’t seen in over 15 years. At a level of 5,985 this afternoon, the index is just fifteen points from a first-time crossing of a 1,000 point threshold. The table below lists each prior thousand point level that the Nasdaq has crossed over time, along with how many times it crossed each level (on a closing basis) to both the upside and downside. After first crossing above 5,000 back in March 2000, the Nasdaq has gone more than seventeen years without crossing another 1,000 point milestone. What makes this drought even crazier is that the amount of time it took the Nasdaq to first cross 1K, 2K, 3K, 4K, and 5K (1,697 calendar days) was less than a third of the 6,255 days that have transpired since that first close above 5K. In other words, from July 1995 through March 2000, the Nasdaq quintupled in less than a third of the amount of time that it has since taken to advance 20%!
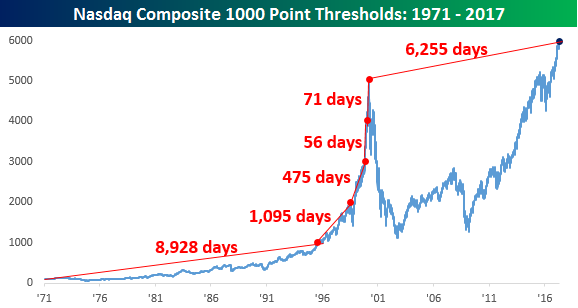
The chart below shows each of the dates that the Nasdaq first crossed every 1,000 point level from 1,000 through 5,000. As shown, some of these milestones came and went quickly. Back in late 1999, the Nasdaq rallied 33% from 3,000 to 4,000 in the span of less than two months. Then, as an encore, it spiked another 25% in just over two months. What’s even more amazing about these huge moves in such short periods of time is that, at the time, people actually thought it was perfectly normal!
Start a 14-day free trial to Bespoke’s research for more stock market analysis.
Apr 24, 2017
Start a 14-day free trial to see Bespoke’s best and most actionable research.
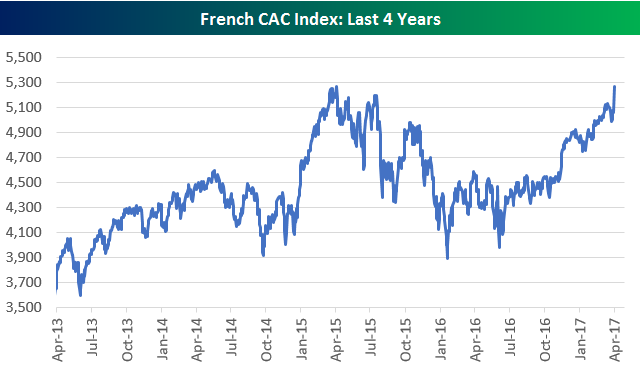
France’s CAC 40 (it’s most widely followed equity index) gained 4.14% today (in local currency), which was its biggest one-day gain since August 2015. Below is a chart of the CAC 40 over the last four years. While the index was set to close at a new 4-year high today when we got into the office early this morning, it actually closed the day at 5,268.86, which is just 0.05 points below its closing high of 5,268.91 reached on April 27th, 2015! French investors will have to wait at least one more day for a new closing high.
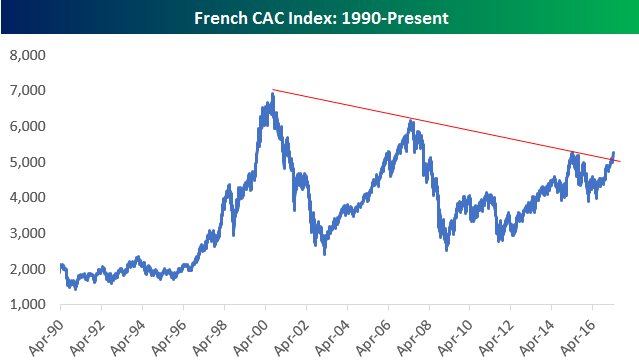
While the French equity market is just a hair off four-year highs, it’s still well below its high seen during the last two bull markets. Below is a chart of the CAC 40 going back to 1990. The all-time high for France was back in 2000, and its second highest point came at the end of the mid-oughts bull market just before the Global Financial Crisis.
One thing that the current rally has done is break a series of “lower highs” that the CAC had been stuck in. We’ve drawn a trend-line in the chart below so you can see the break, which is a positive if you follow market technicals.
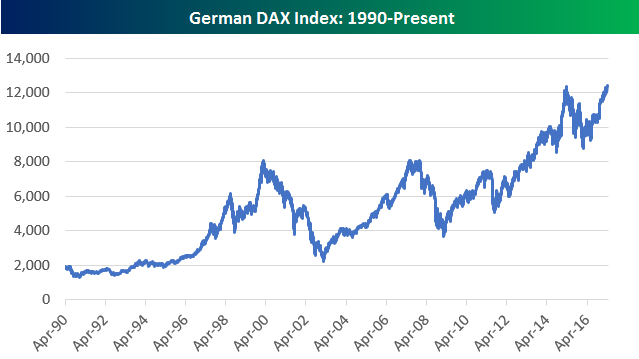
Ironically, while France’s equity market didn’t quite close at a new multi-year high today, Germany’s market did. In fact, it was a new all-time high for the DAX, which rallied 3.37% on the day, and provides another ilustration of how Germany has been the biggest beneficiary of the single-currency union. Below is a chart of the DAX going back to 1990. While France is still 23% below its all-time high from the year 2000, Germany is up 54% since that same point in time.
Start a 14-day free trial to Bespoke’s research platform to see more of our global equity market analysis.