Apr 25, 2017
Log-in here if you’re a member with access to the Closer.
Looking for deeper insight on global markets and economics? In tonight’s Closer sent to Bespoke Institutional clients, we recap Richmond Fed district activity indices, new home sales, Case-Shiller home prices, and ECB bank lending survey data for Q2 updated today.

The Closer is one of our most popular reports, and you can sign up for a free trial below to see it!
The Closer is one of our most popular reports, and you can see it and everything else Bespoke publishes by starting a no-obligation 14-day free trial to our research!
Apr 25, 2017
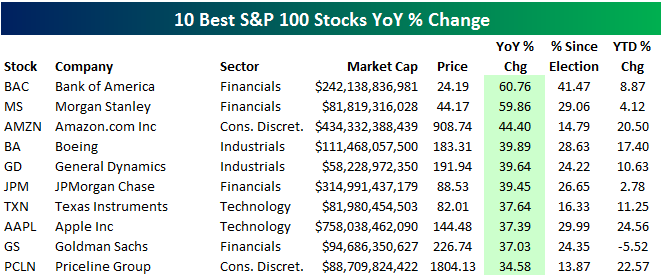
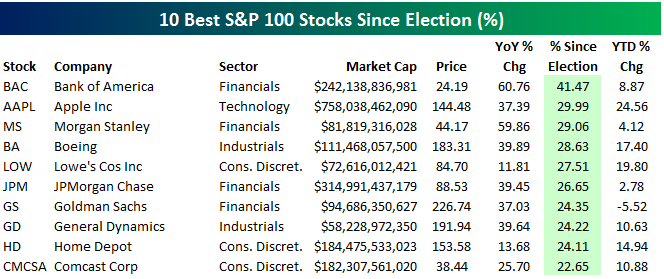
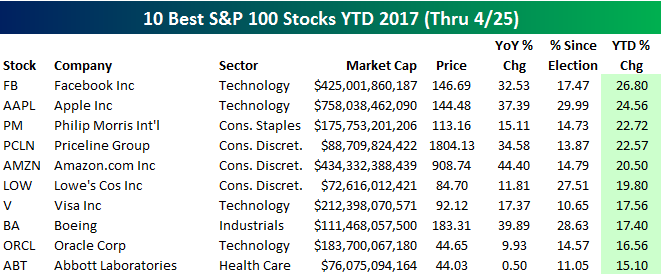
Below we provide tables highlighting the 10 best performing stocks in the S&P 100 (100 largest stocks in the S&P) over three different time periods — year-over-year, since the 11/8/16 election, and year-to-date.
As shown, Bank of America (BAC) and Morgan Stanley (MS) top the list of winners over the last year with gains of 60%. Amazon.com (AMZN) ranks third with a gain of 44.4%, followed by Boeing (BA) and General Dynamics (GD). Apple (AAPL) ranks 8th best with a YoY gain of 37.39%.
With a gain of 41.47%, Bank of America (BAC) also tops the list of biggest winners since last November’s election. Tech-behemoth Apple (AAPL) ranks second best with a gain of 29.99%. Even though it’s the biggest company in the world, Apple has quietly posted huge returns over the last 6-12 months.
Facebook (FB) has also quietly posted big gains recently. The stock is currently the top performer in the S&P 100 in 2017 with a gain of 26.80%. Apple (AAPL) ranks second with a gain of 24.56%, while Philip Morris International (PM) is up the third most at +22.72%.
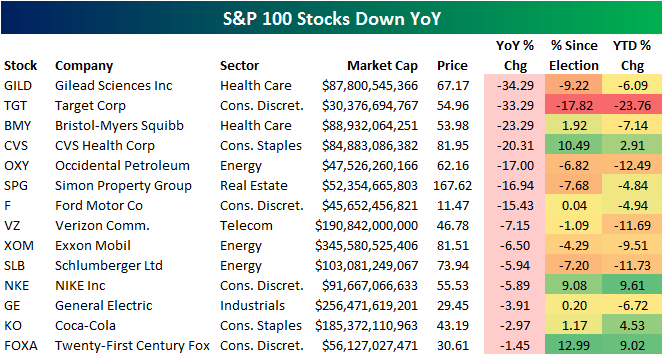
Of course not every stock is up. In the S&P 100, there are 14 stocks that are down over the last year, and we highlight them in the table below. Gilead (GILD) and Target (TGT) are down the most with declines of more than 33%. Bristol-Myers (BMY) and CVS Health (CVS) are the two remaining names that are down 20%+. Other notables on the list of YoY losers include Ford (F), Verizon (VZ), Exxon Mobil (XOM), Nike (NKE), General Electric (GE), and Coca-Cola (KO).
Apr 25, 2017
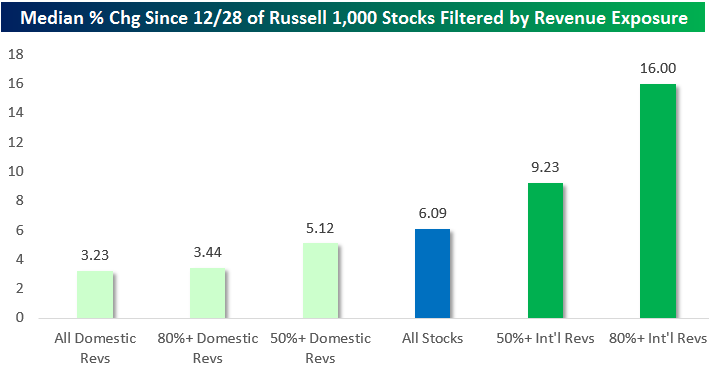
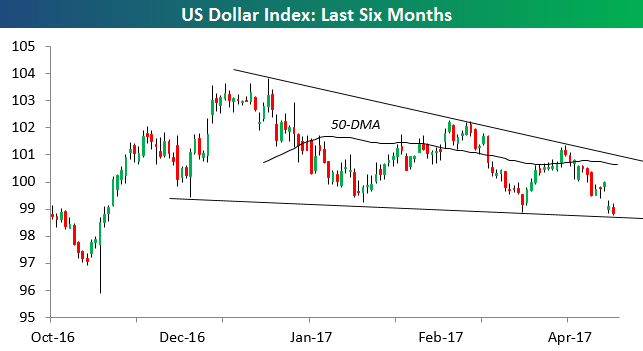
With “rest of world” outperforming US equity markets so far in 2017, and the US Dollar index fading since it peaked on 12/28/16, it should come as no surprise that US companies that generate a large portion of their revenues outside of the US are outperforming their domestic counterparts.
Using our Interactive International Revenues Database, which allows subscribers to pull up the international and domestic revenue exposure for any stock in the Russell 1,000 or S&P 500, we calculated the median performance of stocks based on revenue exposure levels since the US Dollar’s peak on 12/28. The results are shown in the chart below.
The median % change for all stocks in the Russell 1,000 since 12/28 is +6.09%. But stocks that generate more than 80% of their revenues internationally (outside of the US) have seen a median gain of 16%. On the flip side, stocks that generate 80%+ of their revenues domestically are up just 3.44%. That’s a huge difference in performance versus the benchmark. One group has outperformed by more than 10 percentage points (the “Internationals”), while the other group has underperformed by half.
Start a no-obligation 14-day free trial to Bespoke Institutional to use our International Revenues Database now.