Apr 27, 2017
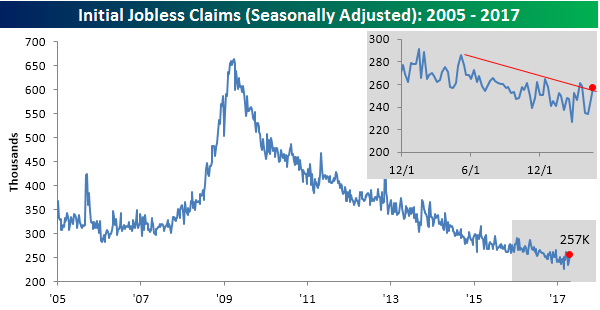
After three solid reports, jobless claims for the latest week saw a relatively large jump, rising from 243K up to 257K. That’s considerably higher than economist estimates for a decline to 242K. As shown in the chart below, claims are now once again bumping up against the downtrend line that has been in place for some time now. Obviously, claims can’t go down forever, but this is a reading to watch closely in the next few weeks. Anything sideways would be fine, but a significant run higher would be bad news for bulls. This week’s report also covered the Easter holiday, so there’s also the possibility that the numbers were distorted by the holiday.
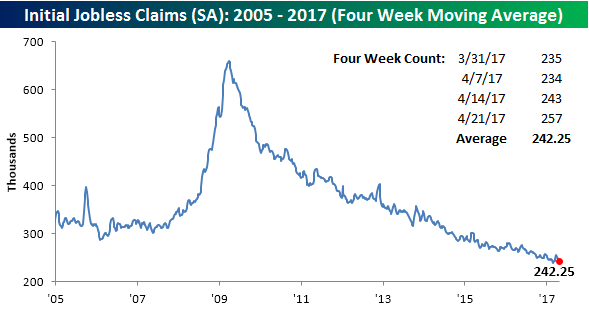
Even with the relatively large jump in claims, the four-week moving average actually declined from 242.75K down to 242.25K. That provides some consolation from the jump in the weekly reading, but a good number this week would have brought the four-week moving average to a new low (below 239.75K).
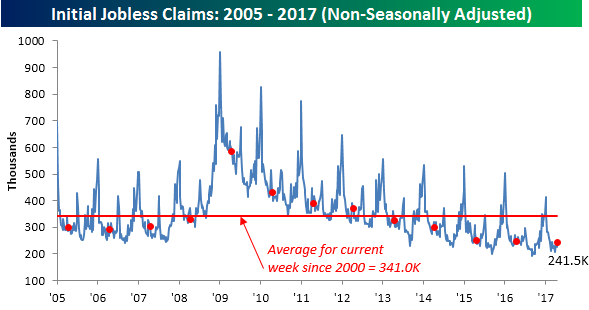
On a non-seasonally adjusted basis, jobless claims came in at 241.5K which was just under 100K below its historical average for the current week of the year since 2000.
Apr 26, 2017
Log-in here if you’re a member with access to the Closer.
Looking for deeper insight on global markets and economics? In tonight’s Closer sent to Bespoke Institutional clients, we take a trip around North and South America, reviewing recent data and currency developments in Canada, Mexico, and Brazil before previewing a massive overnight data slate that includes 44 economic indicators and 3 central bank indicators released between now and the end of the day tomorrow.

The Closer is one of our most popular reports, and you can sign up for a free trial below to see it!
The Closer is one of our most popular reports, and you can see it and everything else Bespoke publishes by starting a no-obligation 14-day free trial to our research!
Apr 26, 2017
The charts below are part of our semi-monthly update on short interest for stocks in the S&P 1500. To gain access to these charts for every sector and group in the S&P 1500, start a 14-day free trial to Bespoke’s research today!
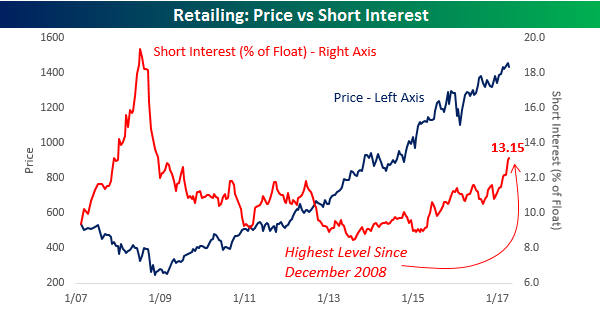
Short interest figures for the middle of April were released after the close on Tuesday, and in what has become a consistent trend over the last several months, traders continue to pile into the Death By Amazon trade. The chart below compares the price of the S&P 1500 Retailing Index (left axis) to the average level of short interest (as a percentage of float) for stocks in the group (right axis). After hitting its lows for the bull market in mid-2013, the average level of short interest started trending higher and the pace really began to accelerate to the upside in early 2015. Since then, the pace of increase has only accelerated and currently stands at 13.15%. That’s the highest reading for the group since December 2008! Looking at the chart, it would appear as though investors who are shorting the group are getting taken out to the woodshed as the group’s price is right near bull market highs. This chart is quite misleading, though, as stocks like Amazon.com (AMZN) and Home Depot (HD) mask the overall trend. Underneath the surface, there is a lot of weakness in individual names.
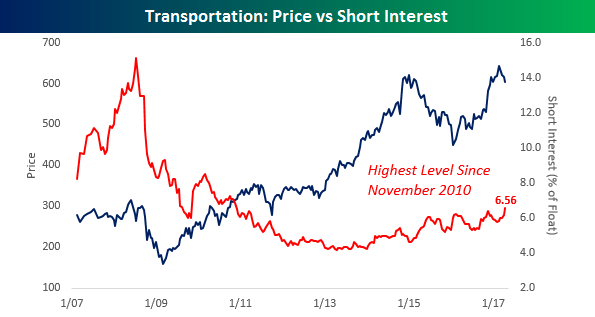
Another group that has seen a rather steady but unnoticed increase in its average level of short interest is the Transportation group. While short interest in these stocks is nowhere near as high as it is in the Retailing group, at a level of 6.56%, the group’s average short interest as a percentage of float is the highest it has been since November 2010.
Apr 26, 2017
Bespoke’s Chart of the Day is published Monday through Thursday. It’s available across all three of Bespoke’s membership levels, which you can learn more about here. We’ve decided to make today’s Chart of the Day available to our Think B.I.G. readers. Enjoy!
Bespoke’s Chart of the Day for 4/26/17:
Three Bespoke Model Growth Portfolio names have moved huge on earnings in the last 24 hours. Two are current members of the portfolio, while a third is one we were stopped out of just last week. Below we provide a few thoughts on each. (You can view the entire portfolio along with performance numbers here.)
We’ll start with a huge win for Steve Wynn’s Wynn Resorts (WYNN), which beat on EPS and revenues last night. The business continues to improve as Chinese activity rebounds and one analyst upgraded the stock. Macau revenues are exploding as the Palace property builds steam, with combined Macau + Palace segment revenues +75% YoY. We’re still bullish on WYNN here even though we have an 87.5% gain on the position since we entered at $67.03 on 1/4/16. Note the chart below. Even though WYNN is now up 144% off its multi-year low, remember that back in early 2014 this was a $250 stock. At its current price, it still needs another double to get back to new highs.

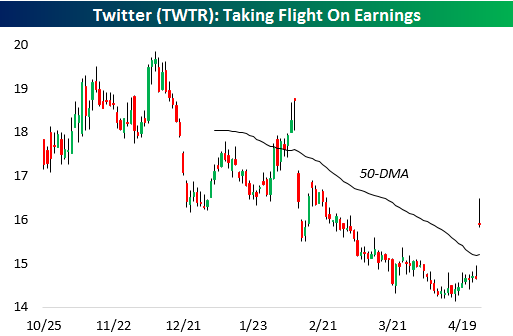
Moving on to our second position, Twitter (TWTR) is up 9.6% on the day after having ground lower almost constantly over the past year as take-out prospects dimmed and the business continued to show soggy user growth versus peers. GAAP EPS losses were half of analyst estimates in this morning’s announcement, though, with revenues and users also beating estimates. The name is still down from our $18.70 entry level but the beat this quarter and subsequent price rise means that nearly universal negative sentiment towards the name finally appears to be turning.
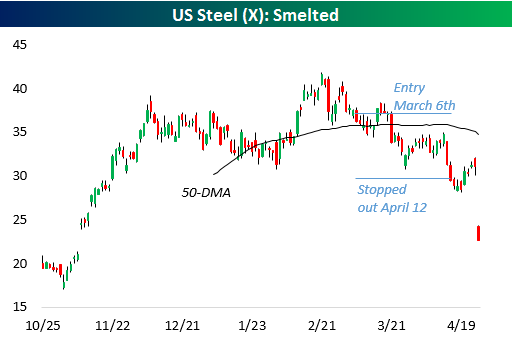
Our last name is US Steel (X). We liked the name in Q1 and added it to the portfolio on March 6th. Unfortunately, we were dead wrong, and the name sunk lower during our holding period, ultimately stopping us out on April 13th with a significant loss. That said, we were glad we respected the $29.60 stop that had been set. By exiting the name at that level, we avoided the catastrophe that was today’s earnings. X delivered an 83-cent per share loss on a comparable basis versus 35 cents profits estimated, a brutal performance. This is a good example of why we always respect stops, our most important risk management tool.
To unlock all of our Chart of the Days as well as our Bespoke Model Portfolio, choose any membership level now at our products page. Both are included with all three membership levels.