Apr 3, 2017
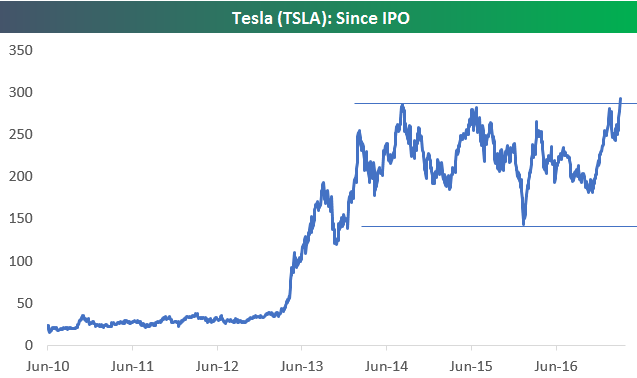
Tesla (TSLA) is trading up 4%+ today on the back of strong delivery numbers, leaving the stock at a new all-time high. Below is a chart of Tesla (TSLA) since its IPO back in 2010. While it may seem like the stock has been going up forever recently, it has actually been trading in a range between $140 and $280 over the last two and a half years. Is today’s breakout to new highs the start of another big leg higher?
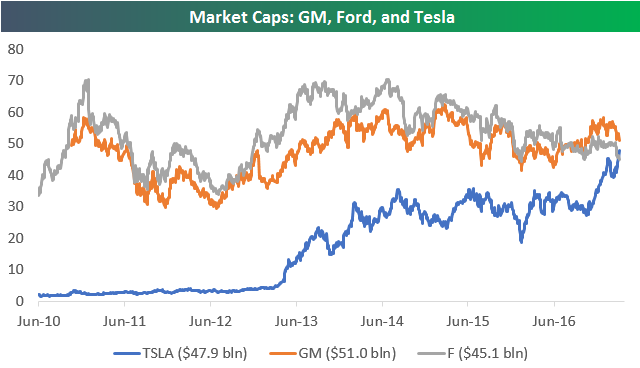
One interesting side note to today’s breakout for Tesla is that its market cap has surpassed the market cap of Ford (F) for the first time ever. Below we highlight the changes in market cap for Tesla (TSLA), Ford (F), and General Motors (GM) over time. At $47.9 billion, Tesla’s market cap is now $2.8 billion larger than Ford, and it’s $3.1 billion smaller than GM. It seems like it’s only a matter of time before Tesla eclipses GM as well.
In our view, one of the main reasons that short sellers have had such a problem with Tesla is that they view it as a car company first and compare it to companies like GM and Ford. When you view Tesla as a Technology company instead of a car company, the game changes completely.
Apr 3, 2017
Oil and energy related ETFs have rallied the most over the past week with banks, MLPs, and transports also supporting the rally. South Africa, Poland, and gold miners have been the weakest ETFs over the past week, with a number of developed market currencies, EM country ETFs, and pharma stocks also trailing.

Bespoke provides Bespoke Premium and Bespoke Institutional members with a daily ETF Trends report that highlights proprietary trend and timing scores for more than 200 widely followed ETFs across all asset classes. If you’re an ETF investor, this daily report is perfect. Sign up below to access today’s ETF Trends report.
See Bespoke’s full daily ETF Trends report by starting a no-obligation free trial to our premium research. Click here to sign up with just your name and email address.
Apr 3, 2017
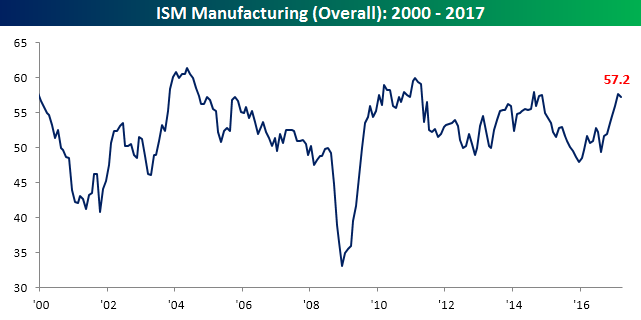
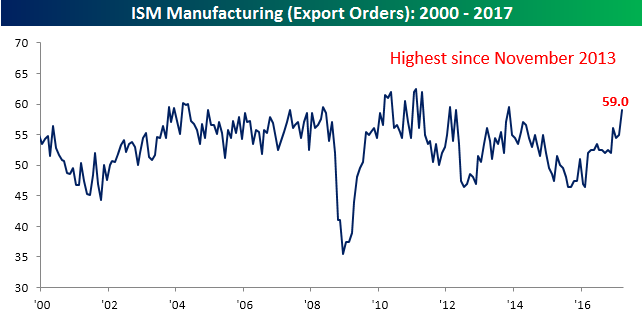
After hitting its highest level in over two years in February, ISM Manufacturing for March saw a modest pullback. Economists were expecting the headline reading to fall to 57.2 from last month’s reading of 57.7, and that is exactly where it came in. it will be interesting to see how the next few months play out from here because prior rallies in the ISM Manufacturing report throughout this cycle have all peaked around these levels.
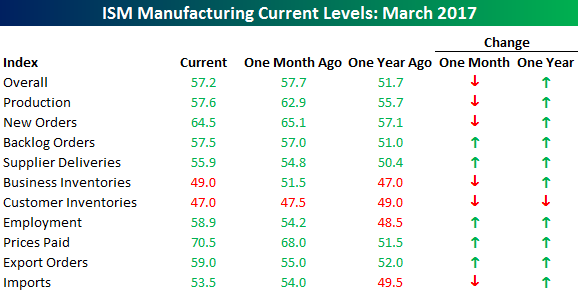
The table below lists the month/month and year/year changes for the ISM Manufacturing report and each of its components. Breadth was mixed this month as five components increased m/m and five declined. The biggest gainers were Employment, Export Orders, and Prices Paid. On the downside, Production saw the largest decline, but this came after it hit its highest level since March 2011 last month. On a y/y basis, breadth was much more positive as Customer Inventories is the only component that is down relative to last year.
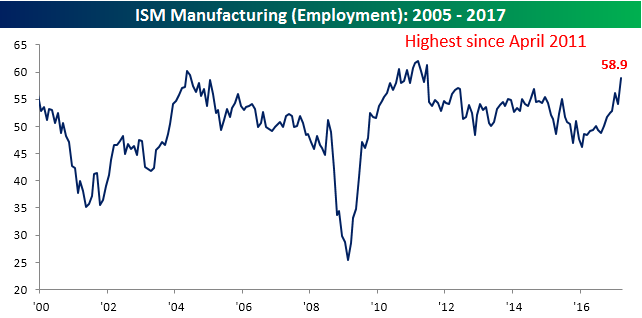
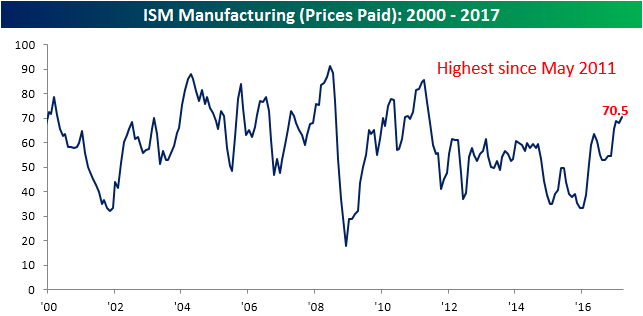
As mentioned above, Employment, Export Orders and Prices Paid saw the largest m/m increases this month. All three components have surged on a y/y basis as well. As shown in the charts below, Employment is currently at its highest level since April 2011, Prices Paid is at its loftiest level since May 2011, while Export Orders hasn’t been this strong since November 2013. The last time Employment surged more on a y/y basis was from August 2009 through August 2010.
Want to see more? Start a two-week no obligation free trial to Bespoke’s premium research platform.
Apr 3, 2017
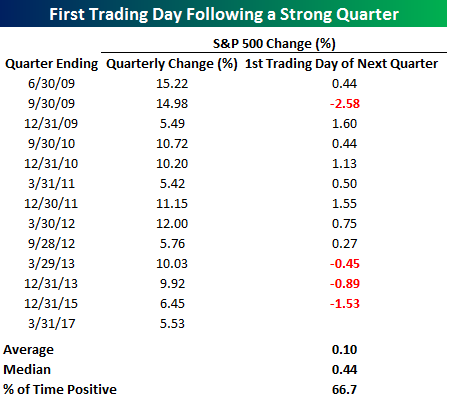
Q1 of 2017 marked the 13th quarter during the current bull market where the S&P 500 rallied more than 5%. In a blog post last week, we highlighted the fact that the S&P 500 tended to consistently close out strong quarters on a weak note, which is exactly what we saw in Friday’s trading as equities sold off moderately right ahead of the closing bell. So is there any pattern to the first trading day of a new quarter following a strong quarter?
The table below lists the S&P 500’s daily change on the first trading day following a quarter where the S&P 500 was up more than 5%. Up until the last three strong quarters, the first day following a strong quarter was consistently positive as the S&P 500 was up nine out of ten times. However, with three straight occurrences where the S&P 500 declined, the overall results, while still positive, are not as strong. Overall, the S&P 500 has averaged a gain of 0.10% (median: +0.44%) to open new quarters following a strong quarter with gains two-thirds of the time.
Apr 3, 2017
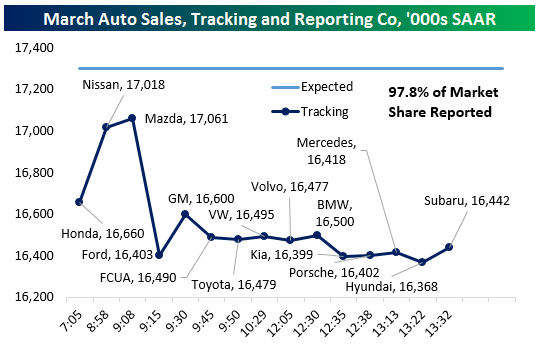
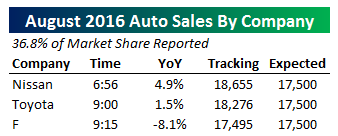 We only have three auto manufacturers reported as-of 9:15 AM EST, but as-of that time of writing Honda got March US Auto Sales off to a poor start. To be specific, the 70 bps YoY drop was made much worse because March 2017 has a more favorable combined calendar and day trade adjustment than a year ago. Nissan and Mazda both did much better, each seeing sales rise by 3-5% YoY NSA. With 20% of the auto industry reported (by volume), sales are tracking a miss but things look much less grim than they did right after Honda announced its sales just after 7:00 AM. We will continue to update our tracker as new results come in throughout the day.
Update 1 9:24 AM EST: Ford missed, delivering -7.2% YoY sales growth versus -5.9% expected by analysts; both are NSA, with no adjustment for the number of sales days in the month. That said, the consequences were brutal for the overall industry sales pace which by our calculation is tracking 16.403mm seasonally adjusted annual rate in March with about 1/3rd of the industry reported.
Update 2 9:59 AM EST: Things are not getting better for the auto industry as reports roll in. After Ford’s huge hit to our tracker (shaving over 650,000 SAAR from the sales pace in one fell swoop) GM made a positive impact despite missing estimated (+7.0%) significantly with the 1.6% sales gain versus a year ago. Fiat-Chrysler also missed, delivering a 5% volume drop versus expectations for roughly unchanged YoY sales. Toyota was even worse, with US sales falling 2.1%. With 80% of the industry reported, the sales pace we are tracking is only marginally above dismal February 2015 numbers, and stands a chance of coming in at the lightest pace in almost 3 years.
Update 3 1:52 PM EST: With smaller auto OEMs reporting vehicle sales throughout the early afternoon, we’re only missing Audi’s numbers and have 97.8% of the market reported as of this writing. Based on our calculations using Bureau of Economic Analysis seasonal adjustment data, we are tracking a big miss in auto sales, with actual pace coming in almost 900,000 SAAR short of what economists expected. To find a weaker number, we have to go all the way back to September of 2014, when the industry delivered sales of 16.24mm SAAR. As shown in the bottom graph, if this sales pace holds it will represent a major decline versus recent prints.