Few Shorts Feeling the Pain From FANG Stocks

If you follow the market even remotely, you know that Q1 was a period where the FANG stocks of Facebook, Amazon, Netflix, and Google Alphabet came back into favor.  Just in the last several trading days, shares of Amazon (AMZN) have broken out to new highs on the back of a six-trading day winning streak where the company has added nearly the equivalent of an entire Target (TGT) to its market cap!  Looking at the performance of AMZN and the rest of the FANG stocks in recent months, one thing that sticks out at first glance is how few of the short sellers have been hurt along the ride. In many cases, when you see stocks rally in the way that these four stocks have run, traders may start to bet against the companies on the premise that they have gotten ahead of themselves.  For the four FANG stocks, though, it seems as though short-sellers have been laying out the red carpet.

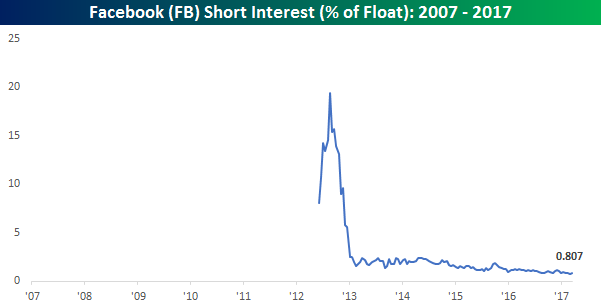
As exhibit A, take a look at Facebook (FB).  As of the most recent data, short interest as a percentage of float in FB is under 1% of the free-floating shares, or 0.807%.  Since the company came public, there have only been two other times where short interest as a percentage of float for the company was lower and they were both this year.  For some perspective, short interest as a % of float for the company was over 15% after it first came public and over 2% three years ago.

FBSI

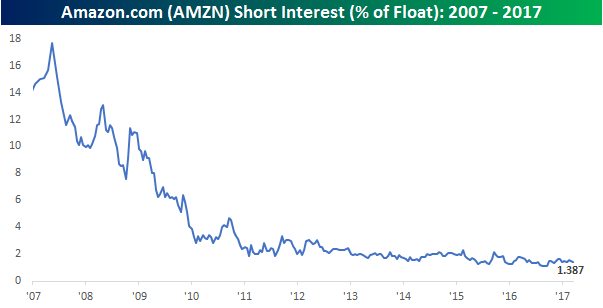
For AMZN, short interest is almost as scarce.  At a level of 1.387%, short interest in AMZN is also near historically low levels.

AMZNSI

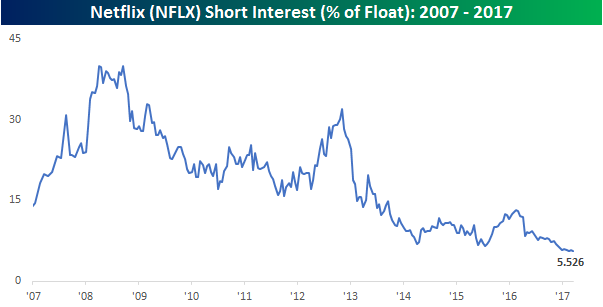
Netflix (NFLX) is a similar story. While its short interest as a % of float is the highest of the four FANG stocks at 5.526%, it is the lowest level that NFLX has ever seen.  As recently as late 2012, its short interest as a % of float was over 30%, and just over a year ago, it was more than double its current levels.

NFLXSI

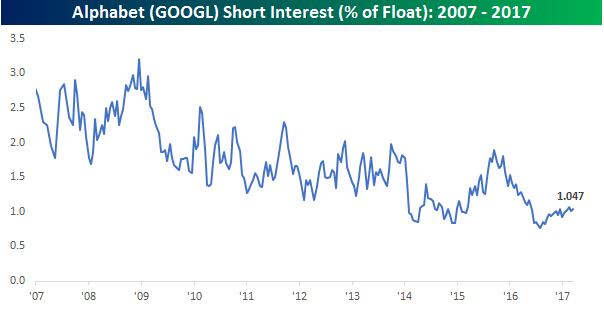
Finally, for Alphabet (GOOGL) its short interest as a percentage of float has actually been increasing in the last several months, but at a level of just over 1% is still extremely low.

GOOGLSI

At first glance, it appears as though there is very little pessimism in the market towards these stock, and from a contrarian perspective, when everyone is leaning one way, the market usually doesn’t follow suit.  That’s certainly a valid argument, but there is one important thing to keep in mind.  All four of these companies are mega-cap stocks, and because they are so large, mega-cap stocks typically have low levels of short interest.  For example, non-FANG stocks with similar market caps such as Exxon Mobil (XOM), Microsoft (MSFT), JP Morgan (JPM) and Johnson & Johnson (JNJ) also all have less than 1% of their float sold short.  In fact, the average short interest as a % of float for the ten largest non-FANG stocks in the S&P 500 is just 0.93%. So, yes, average short interest levels of the FANG stocks are at or near multi-year lows, but it is just as much, if not more a function of their extraordinarily large market caps than it is anything else.  As the market caps of these companies have grown, the amount of capital on the short side hasn’t grown proportionately with them.

The Closer — Autos Awful — 4/3/17

Log-in here if you’re a member with access to the Closer.

Looking for deeper insight on global markets and economics?  In tonight’s Closer sent to Bespoke Institutional clients, we discuss today’s auto sales miss, the impact on US-listed, auto-related equities, and Mexican IMEF PMIs.

Sample

The Closer is one of our most popular reports, and you can sign up for a free trial below to see it!

The Closer is one of our most popular reports, and you can see it and everything else Bespoke publishes by starting a no-obligation 14-day free trial to our research!

A Look at Home Price Data Around the Country

The most recent monthly Case Shiller home price data came out last week, and below we’ve created a number of charts and tables allowing you to see how real estate prices are doing across the US.  Case Shiller is one of the few data-sets that allows you to track home price movements in individual cities.  The one drawback is that the data is on a two-month lag.

Below is a look at month-over-month and year-over-year changes (%) in home prices for the 20 cities tracked by Case Shiller along with the 10-city and 20-city composite indices as well as their “National” index.  As shown, 14 cities saw month-over-month gains, while six saw declines.  Western cities like San Diego, Las Vegas, Seattle, and Denver saw the biggest month-over-month gains, while Minneapolis, Cleveland, San Francisco, and Detroit saw the biggest month-over-month declines.

On a year-over-year basis, Seattle saw the biggest gain at +11.27% — thank you Amazon.com.  Portland jumped the second most at +9.68%.  New York and Cleveland have seen the smallest year-over-year gains.

CStable

Below is a look at the percentage that each city tracked has bounced off of the lows put in during the housing bust back in 2009/2010.  As shown, San Francisco is up 96% from its lows, while New York is up just 18%.  Cleveland is up the second least off its lows at just 20%.

from crash lows

Below is a look at where home prices stand now in relation to the highs in price that were put in at the peak of the last housing bubble back in 2005.  As shown, seven of twenty cities have eclipsed their prior bubble highs, with both Denver and Dallas up more than 30% from their highs back in 2005.  The “National” index also has now eclipsed its prior highs, which is a pretty significant reading.

from bubble highs

Below we provide charts showing the year-over year percentage change for each city going back as far as the Case Shiller data goes.  In most instances the data goes back to 1987, but some cities only have data going back to 2001 or so.  You’ll notice when looking through the charts that year-over-year gains are slowly drifting lower.  So home prices are still rising, but not by nearly as much as they were just a couple of years ago.  San Francisco was posting year-over-year gains of more than 20% back in 2013 and 2014, but in January, home prices in San Fran were up just 6.32% year-over-year.  In terms of trend, cities like Chicago, Boston, and Cleveland are the only ones that have seen a bump up in their YoY readings recently.

CS1

CS2

CS3

CS4