Apr 4, 2017
Oil continues to rebound on a trailing 5 day basis while South Africa (and GAF, which includes South African equities) while Swedish krona, European equities, the euro, and pharma all underperformed. Some strong performers in the US equity markets include Energy, Telecoms, and MLPs.

Bespoke provides Bespoke Premium and Bespoke Institutional members with a daily ETF Trends report that highlights proprietary trend and timing scores for more than 200 widely followed ETFs across all asset classes. If you’re an ETF investor, this daily report is perfect. Sign up below to access today’s ETF Trends report.
See Bespoke’s full daily ETF Trends report by starting a no-obligation free trial to our premium research. Click here to sign up with just your name and email address.
Apr 4, 2017
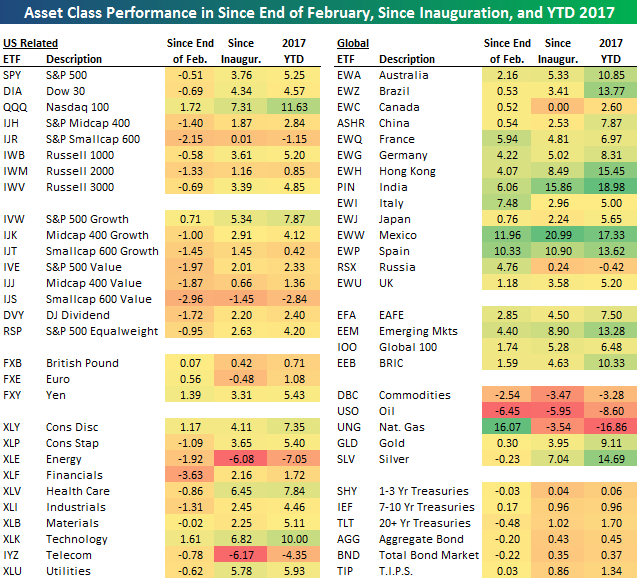
Below is a look at the recent performance of various asset classes using key ETFs that we track daily in our ETF Trends report. For each ETF in the matrix, we provide its percentage change since the end of February, since the close on Inauguration Day (1/20/17), and year-to-date so far for all of 2017.
The left side of the matrix contains mostly US equity related ETFs, while the right side contains international equity ETFs as well as commodity and fixed income ETFs. You’ll notice that international equity markets have performed much better than US equities recently. Many country stock market ETFs are up 5%+ since the end of February, while US equity ETFs are mostly in the red. The Nasdaq 100 (QQQ), the Consumer Discretionary sector (XLY), and the Technology sector (XLK) are the only areas of the US market that are up during this time period.
Year-to-date, the India (PIN) and Mexico (EWW) ETFs are up the most with gains of more than 17%, while natural gas (UNG) is down the most at -16.86%. Fixed income ETFs are up modestly year-to-date, but they’re down slightly since the end of February.
Apr 4, 2017
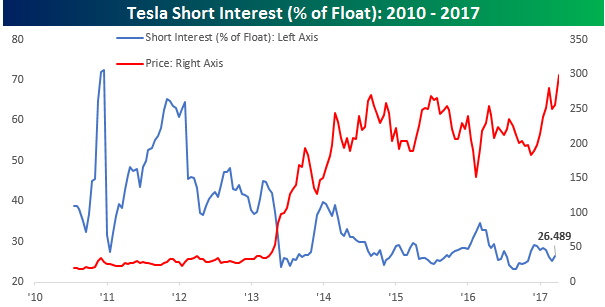
Earlier today, we highlighted that while the FANG stocks have been flying lately, short interest for them has not. One name that has been flying lately where short interest remains high relative to most other stocks is Tesla (TSLA). As shown in the chart below, as the company’s stock price moves towards $300 per share, more than a quarter of the stock’s float is still shorted. Tesla (TSLA) CEO and founder, Elon Musk, poured some salt in the wounds of the shorts yesterday when he tweeted that there’s “Stormy weather in shortville.”
While it has been painful to be short TSLA in the last several months, even here, short interest as a percentage of the float for the stock is near the lowest levels it has been since the company came public. In early 2016, for example, short interest as a % of float was close to 35% for TSLA, while five years ago it was closer to 50%. It may be stormy, but it could have been a lot stormier.