Apr 27, 2017
European ETFs continue to dominate the best performance list thanks to their post-election bump but we should note most are off their best levels as the gains were added all at once but haven’t had a follow-on. Gold miners continue to suffer, down about 8%, while oil and energy ETFs also rank high on the list of best performers we track.

Bespoke provides Bespoke Premium and Bespoke Institutional members with a daily ETF Trends report that highlights proprietary trend and timing scores for more than 200 widely followed ETFs across all asset classes. If you’re an ETF investor, this daily report is perfect. Sign up below to access today’s ETF Trends report.
See Bespoke’s full daily ETF Trends report by starting a no-obligation free trial to our premium research. Click here to sign up with just your name and email address.
Apr 27, 2017
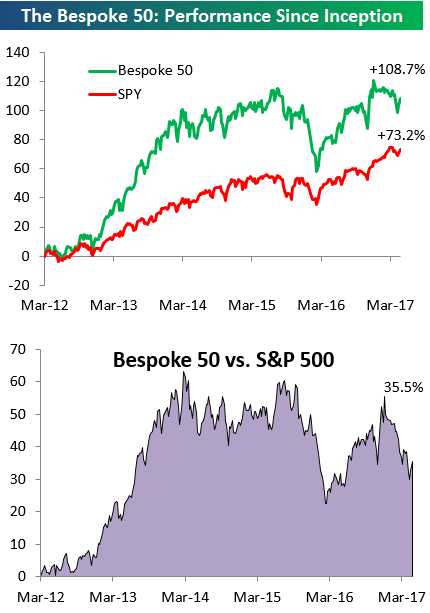
Every Thursday, Bespoke publishes its “Bespoke 50” list of top growth stocks in the Russell 3,000. Our “Bespoke 50” portfolio is made up of the 50 stocks that fit a proprietary growth screen that we created a number of years ago. Since inception in early 2012, the “Bespoke 50” has beaten the S&P 500 by 35 percentage points. Through today, the “Bespoke 50” is up 108.7% since inception versus the S&P 500’s gain of 73.2%. Always remember, though, that past performance is no guarantee of future returns.
To view our “Bespoke 50” list of top growth stocks, sign up for Bespoke Premium ($99/month) at this checkout page and get your first month free. This is a great deal!
Apr 27, 2017
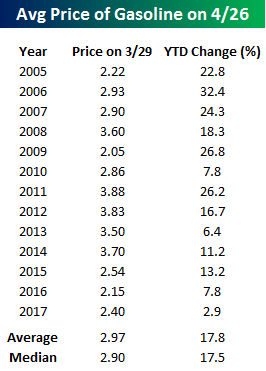 It may sound hard to believe, but one month from today marks the Saturday of Memorial Day Weekend. Memorial Day weekend typically marks the start to the summer driving season, so it is a time of year where gas prices increasingly become an area of focus. If you are planning to do much driving this year, though, you are in for a pleasant surprise at the pump when you go to fill up. Looking at the YTD change in gas prices so far this year, prices are only up 2.4%, which is the most anemic price increase at this point in the year we have seen going back to at least 2005. Since then, there have only been three other years where the YTD change through 4/26 was less than a double-digit percentage gain, and the average YTD change at this point in the year is 17.8% (median: 17.5%), so 2.9% is nothing!
While prices could certainly go up from here, if they follow anything close to the seasonal pattern, the window for price increases is rapidly coming to a close. The chart below compares the current YTD change in gas prices to a composite of the YTD change in prices for all years since 2005. As shown, prices typically rise in the first half of the year, peak in early June, move sideways for the summer, and then rapidly decline from Labor Day through year end. Therefore, if prices don’t increase much between now and early June, barring a major hurricane in the Gulf or a geopolitical shock, they are unlikely to get much of a lift in the summer.

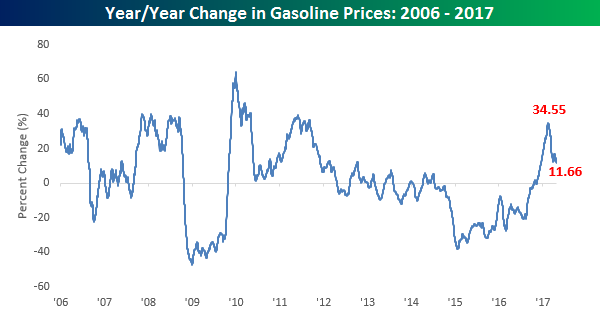
As far as the inflationary impact of gas prices in concerned, any upward pressure is likely to be contained going forward. The chart below shows the y/y change in gas prices since 2006. The surge in the y/y change that we saw towards the end of 2016 was similar to increases that we saw in other commodities and was a big contributor to the upward pressure in CPI. However, now that the base effects that contributed to the upward move in the CPI are running off, the pace of increase in y/y readings is quickly declining. After peaking out at a 34.55% y/y change in late February, gas prices are now up a relatively modest 11.7% y/y.
Apr 27, 2017
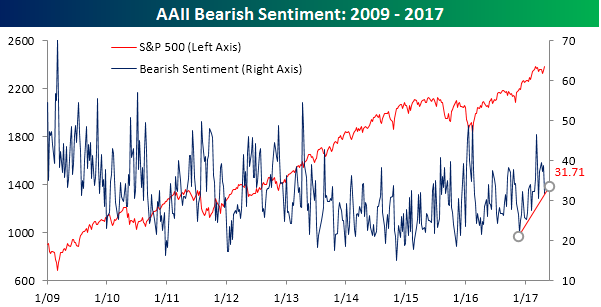
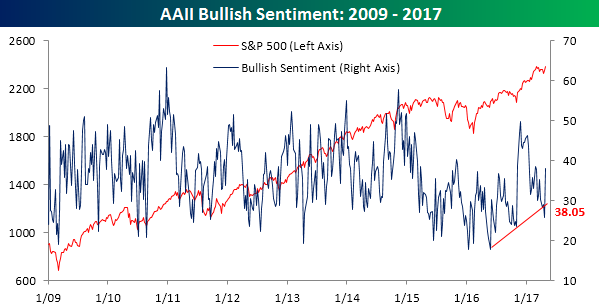
After dropping to its lowest level since the election, bullish sentiment on the part of individual investors surged by the most this week since the week after the election. According to the weekly survey from the American Association of Individual Investors (AAII), after just one-quarter of individual investors considered themselves bullish last week, more than 38% now put themselves in the bullish camp. So was it the French election that individual investors were so worried about (kidding)? Even with this week’s increase, a little perspective for this poll is in order, as it has now been 121 straight weeks since bulls were in the majority.
What we will be watching in this poll next week is what happens with bearish sentiment. In this week’s survey, bears decline from 38.7% down to 31.71%. Even after this week’s decline, the uptrend in bearish sentiment that has been in place since late last year remains in place (chart below). If that uptrend breaks, it could be a precursor for a move to a majority in the bullish camp.