Wall Street Strategists Not Enthusiastic From Here
At the end of 2016, we published this post on year-end price targets for Wall Street strategists. For 2017, the average strategist projected the S&P 500 to post a gain of 5.5%. That’s actually bearish relative to the average annual projection going back to 2000. As shown below, on average, Wall Street strategists collectively project a gain of 9.6% each year. In 2016, strategists predicted the S&P would gain 8.4%, which ended up being just 1.1 percentage points away from the actual gain of 9.5% seen last year. That was the closest they’ve ever gotten to hitting the mark. Normally, they’re about 5.5 percentage points above the actual year-end change.

Bloomberg tabulates these year-end estimates from strategists throughout the year. As mentioned above, at the start of 2017, the average year-end price target for the S&P 500 was 2,362. That would have translated into a gain of 5.5% based on where the index began the year. So where do strategists stand now that we’re already into the second quarter? They’ve gotten slightly more bullish, but they’re still looking for hardly any gains. As shown below, the average Wall Street strategist currently sees the S&P 500 ending 2017 at a level of 2,414. That’s an additional gain of 3% from the S&P’s current level. Normally a sanguine bunch, strategists are currently rather apathetic.
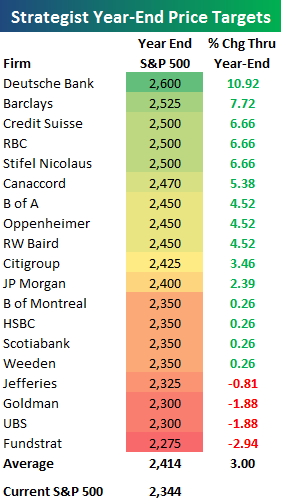
Chart of the Day: From Hero to Zero- Tech Sector Losing Streaks
This content is for members onlyFixed Income Weekly – 4/12/17
Searching for ways to better understand the fixed income space or looking for actionable ideals in this asset class? Bespoke’s Fixed Income Weekly provides an update on rates and credit every Wednesday. We start off with a fresh piece of analysis driven by what’s in the headlines or driving the market in a given week. We then provide charts of how US Treasury futures and rates are trading, before moving on to a summary of recent fixed income ETF performance, short-term interest rates including money market funds, and a trade idea. We summarize changes and recent developments for a variety of yield curves (UST, bund, Eurodollar, US breakeven inflation and Bespoke’s Global Yield Curve) before finishing with a review of recent UST yield curve changes, spread changes for major credit products and international bonds, and 1 year return profiles for a cross section of the fixed income world.
In this week’s note, we project the pace at which principal would be repaid on instruments held by the Fed in its SOMA portfolio assuming an immediate halt to reinvestment of principal from those QE purchases.

Our Fixed Income Weekly helps investors stay on top of fixed income markets and gain new perspective on the developments in interest rates. You can sign up for a Bespoke research trial below to see this week’s report and everything else Bespoke publishes free for the next two weeks!
Click here to start your no-obligation free Bespoke research trial now!
ETF Trends: Fixed Income, Currencies, and Commodities – 4/12/17
Despite the furious rally in oil over the past five days (with USO and DBO taking the top two spots within the universe of ETFs we track) Russian equities have been among the worst performers. Base metals, natural gas, steel, semis, and EM countries have also underperformed though Turkey and South Africa have both been big gainers. Retail, REITs, and gold miners have also been good performers.

Bespoke provides Bespoke Premium and Bespoke Institutional members with a daily ETF Trends report that highlights proprietary trend and timing scores for more than 200 widely followed ETFs across all asset classes. If you’re an ETF investor, this daily report is perfect. Sign up below to access today’s ETF Trends report.
See Bespoke’s full daily ETF Trends report by starting a no-obligation free trial to our premium research. Click here to sign up with just your name and email address.