Apr 13, 2017
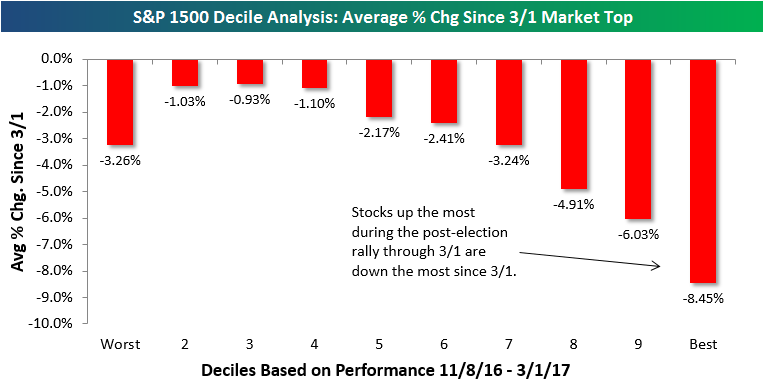
The average stock in the S&P 1500 (contains large, mid, and small caps) is down 3.35% since the index peaked on March 1st. We broke the S&P 1500 into deciles (10 groups of 150 stocks each) based on stock performance from election day 2016 (11/8/16) through the March 1st equity market peak to see how the biggest post-election winners and losers have been doing during the current pullback. As shown, the decile of stocks that did the best during the post-election rally from 11/8/16 through 3/1/17 are down an average of 8.45%. Clearly investors have been selling the biggest “Trump Trade” winners since the beginning of March.
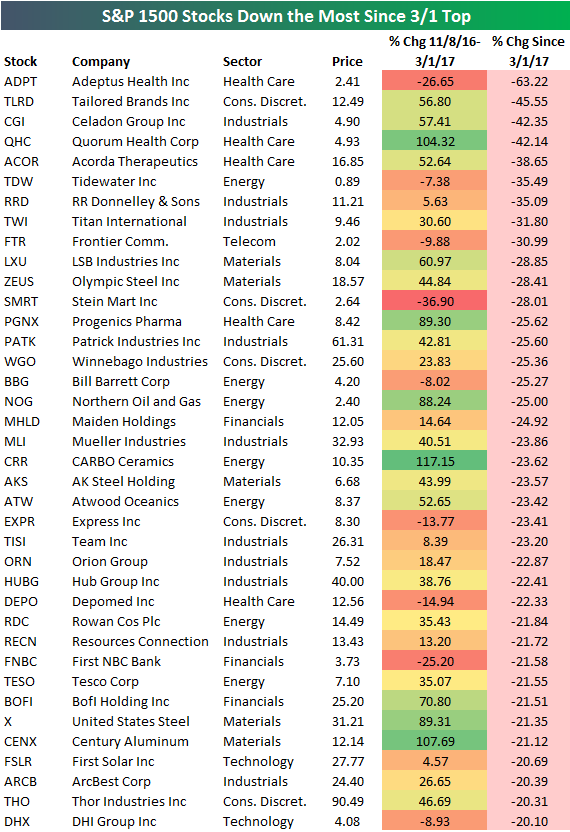
Below is a list of the worst performing stocks in the S&P 1500 since the March 1st equity market peak. All of the names listed are down 20%+. Notables include Frontier Communication (FTR), AK Steel (AKS), Winnebago (WGO), US Steel (X), and First Solar (FSLR). It’s been just a brutal few weeks for these names.
Apr 13, 2017
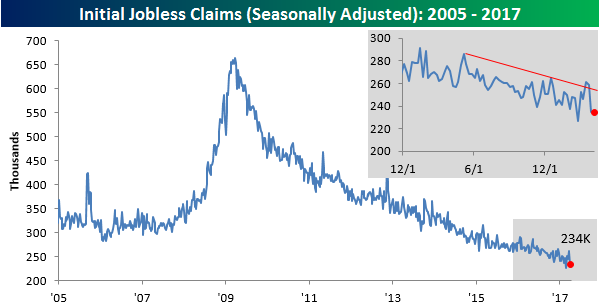
Remember back a couple of weeks ago when weekly jobless claims “spiked” up above 250K for two weeks? After those two weeks of elevated readings back in mid-March, jobless claims have dropped back down near their cycle lows. In this week’s report, claims came in at 234K, which was down 1K from last week’s revised reading and 11K below consensus estimates. Claims have now been below 300K for 110 straight weeks, and any concerns that the labor force was weakening following those two relatively elevated prints last month should be alleviated as it looks increasingly likely that they were more weather related than anything else.
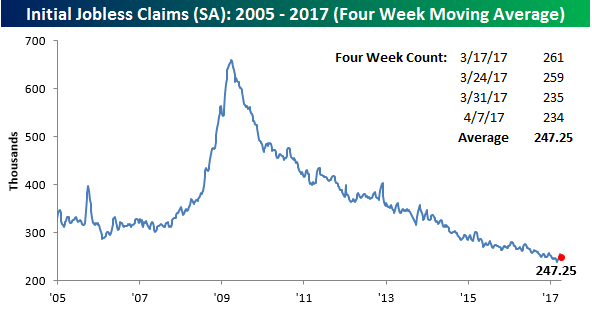
With this week’s decline, the four-week moving average has now dropped 3K down to 247.25K. That puts this reading back within 10K of the cycle low of 239.75K that we saw seven weeks ago.
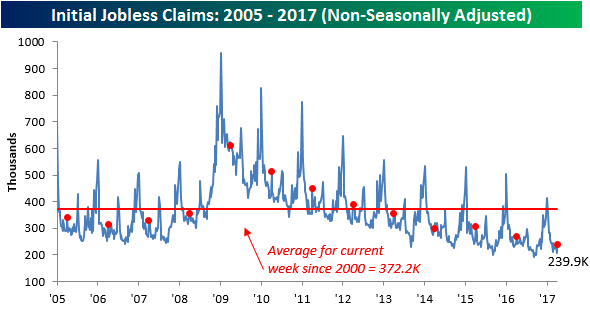
On a non-seasonally adjusted basis, claims were equally as strong. With a print of 239.9K, NSA claims were more than 130K below their historical average of 372.2K for the current week of the year going back to 2000. It is also the lowest print for the current week of the year dating back to 1969.
Apr 12, 2017
Log-in here if you’re a member with access to the Closer.
Looking for deeper insight on global markets and economics? In tonight’s Closer sent to Bespoke Institutional clients, we chart out some possible double tops in global equity indices, summarize weekly EIA petroleum market data, and analyze positioning in the Eurodollar futures market.

The Closer is one of our most popular reports, and you can sign up for a free trial below to see it!
The Closer is one of our most popular reports, and you can see it and everything else Bespoke publishes by starting a no-obligation 14-day free trial to our research!