Apr 13, 2017
 In our newest conversation on Bespokecast, we spoke to Charles Kirk — trader and author of The Kirk Report. Charles has been a leading commentator and analyst of US equity markets since the early 2000s, and he has a long history of collaboration with other investors and analysts, including our firm. We were thrilled to have him on to talk about his career, his unique blend of technical and fundamental analysis, what has helped shape his approach to investing, and how he views the current equity market.
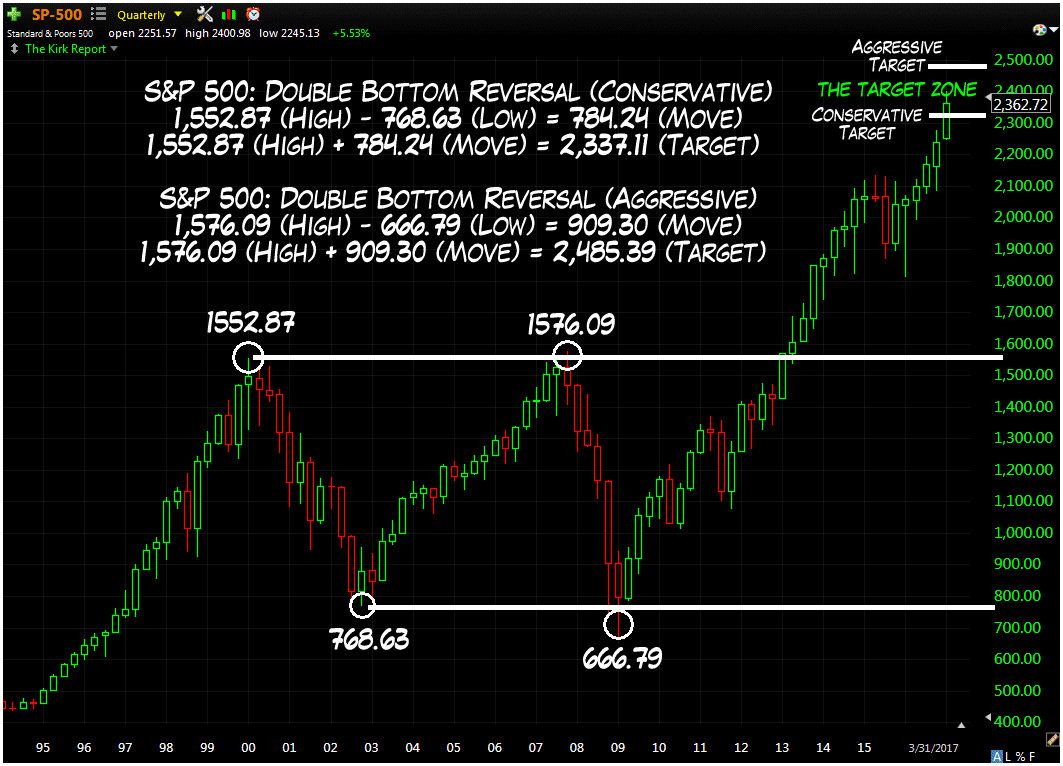
During our conversation, Charles discusses the longer-term pattern currently driving the S&P 500; you can see that chart here. We also spoke with Charles about the advantages of working in the Hawaiian time zone, his passion for pickleball and golf, and the collaborative approach which has helped him find success in the markets. We hope you enjoy the conversation as much as we did!
Listeners can read about or contact Charles directly through his website or at his wiki page.
To access Episode 9 immediately, please start a 14-day free trial to Bespoke’s research product. If you’ve already signed up for a Bespoke free trial in the past, you can gain access by choosing a membership option at our products page. Here’s a look at past guests if you’re interested.

Apr 13, 2017
We’ve just released our weekly Sector Snapshot report (see a sample here) for Bespoke Premium and Bespoke Institutional members. Please log-in here to view the report if you’re already a member. If you’re not yet a subscriber and would like to see the report, please start a 14-day trial to Bespoke Premium now.
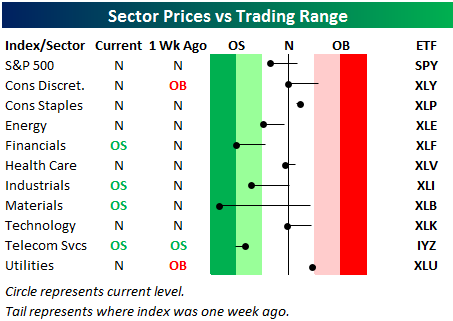
Below is one of the many charts included in this week’s Sector Snapshot, which highlights our trading range screen for the S&P 500 and ten sectors. The black vertical “N” line represents each sector’s 50-day moving average, and as shown, most sectors are now below their 50-DMAs. Four of ten are actually in oversold territory, while none are overbought. (Note that the red zone in the screen is considered overbought territory, while the green zone is considered oversold territory.)
To see our full Sector Snapshot with additional commentary plus six pages of charts that include analysis of valuations, breadth, technicals, and relative strength, start a 14-day free trial to our Bespoke Premium package now. Here’s a breakdown of the products you’ll receive.
Apr 13, 2017
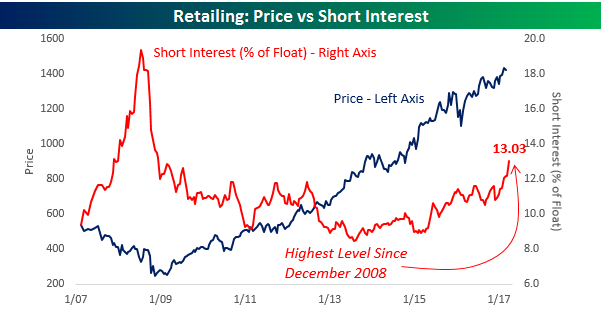
Earlier today, we published an update to our “Death By Amazon” index of stocks, which tracks the performance of stocks in companies whose sales are the most Amazon-able. In the update, we mentioned how the “Death By Amazon” index just recently made a four-year low. On a related note, short interest figures for the end of March were released earlier this week, and looking at the data, Death By Amazon is a trade that hasn’t gone on unnoticed.
The chart below compares the price of the S&P 1500 Retailing Group and the average short interest as a percentage of float (SIPF) for stocks in the group going back to 2007. For the last several months now, average short interest levels have been rising steadily for the group and currently stand at over 13%, which is the highest reading for the group since December 2008. Not since the depths of the financial crisis have traders been more negative on the group, although we would note that they were a lot more negative back then compared to now. One thing to note in this chart is that even though it looks as though the Retailing Group has performed well over the last few years, practically all of the gains in the sector are the result of Amazon.com (AMZN), Home Depot (HD), and Priceline.com (PCLN). Outside of these three stocks, the vast majority of the group’s members have been trending the other way.
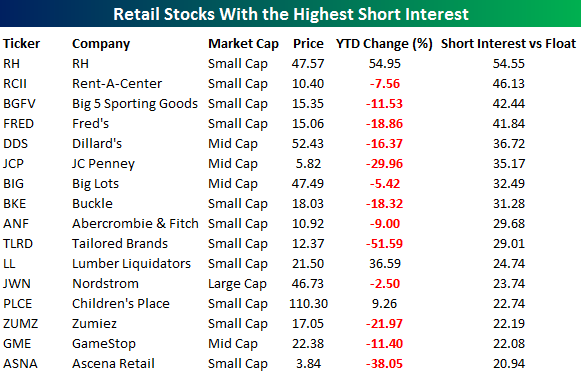
In terms of individual stocks, the table below shows the sixteen stocks in the group that have more than 20% of their float sold short. Looking at the list, all but three stocks are down so far this year. Ironically, the stock with the highest short interest, RH (formerly Restoration Hardware), is up sharply YTD. That’s more of a special situation, though, as RH is coming off hard times from prior years and is still down more than 50% from its highs in late 2015. Lumber Liquidators (LL) is another example. Although it is up 37% this year, it’s trading at a fifth of its level from late 2013. For just about every other stock shown, 2017 has already been a year to forget, especially when you consider the fact that the broader market is up about 5% on the year.
While the outlook for many of the names in the retail space is bleak, there will undoubtedly be some companies that buck the trend and turn things around. In our earlier update to the Death By Amazon index, we actually highlighted one of the names in the list below as a turnaround candidate. So if you haven’t already, sign up for a free trial and check out the report!
Apr 13, 2017
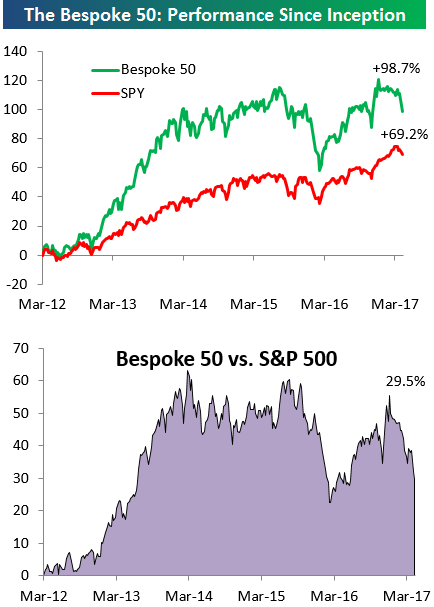
Every Thursday, Bespoke publishes its “Bespoke 50” list of top growth stocks in the Russell 3,000. Our “Bespoke 50” portfolio is made up of the 50 stocks that fit a proprietary growth screen that we created a number of years ago. Since inception in early 2012, the “Bespoke 50” has beaten the S&P 500 by 30 percentage points. Through today, the “Bespoke 50” is up 98.7% since inception versus the S&P 500’s gain of 69.2%. Always remember, though, that past performance is no guarantee of future returns.
To view our “Bespoke 50” list of top growth stocks, sign up for Bespoke Premium ($99/month) at this checkout page and get your first month free. This is a great deal!
Apr 13, 2017
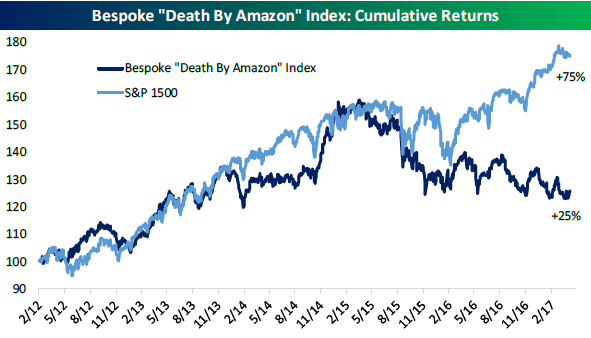
Bespoke created its “Death By Amazon” index back in 2014 as a way to track the retail companies most affected by the rise of Amazon. Companies included must be direct retailers with a limited online presence (or core business based on physical retailing locations), a member of either the Retail Industry of the S&P 1500 or the S&P Retail Select index, and rely primarily on third party brands. We view these attributes as the best expression of AMZN’s threat to traditional retail.
Below is a look at the performance of Bespoke’s “Death By Amazon” index versus the S&P 1500 since the start of 2012. As shown, the index has underperformed the market significantly over this 5-year period. The DBA is up 25% versus the S&P 1500’s gain of 75%. And how has Amazon.com (AMZN) performed since early 2012? It’s up more than 300%.
Each month we provide an update of our “Death By Amazon” index along with a look at the performance of the index’s individual members. In this month’s report, we also feature one long idea from the department store group and one short idea from the “off-price” retailer group.
To see this month’s Death By Amazon report, sign up for a 14-day free trial to our Bespoke Premium research service.