Apr 20, 2017
Commodity and cylical industrial names continue to lag along with gold mining ETFs, Australia, and a number of EM countries. Best performers over the last 5 days in the ETF universe we track are South Afria, Poland, and the GBP tracker FXB. Biotechs, long-term bonds, and REITs have also found good performance.

Bespoke provides Bespoke Premium and Bespoke Institutional members with a daily ETF Trends report that highlights proprietary trend and timing scores for more than 200 widely followed ETFs across all asset classes. If you’re an ETF investor, this daily report is perfect. Sign up below to access today’s ETF Trends report.
See Bespoke’s full daily ETF Trends report by starting a no-obligation free trial to our premium research. Click here to sign up with just your name and email address.
Apr 20, 2017
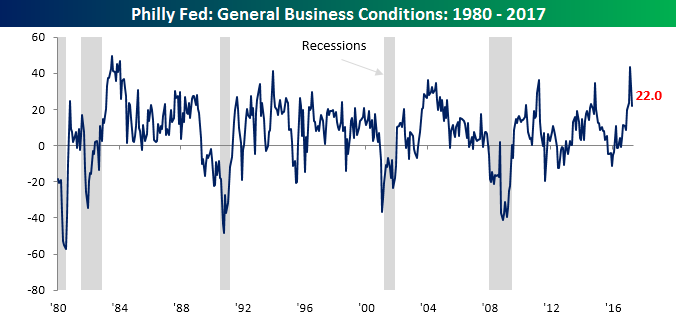
Today’s report on manufacturing in the Philadelphia region followed the trend of its sibling in New York and moved lower in April, posting a larger decline than expected. While economists were expecting the headline index to retreat from March’s multi-month high of 32.8 down to 22.5, the actual reading was slightly lower at 22.0. While both the Philly Fed and Empire Manufacturing reports declined this month, the Philly indicator still remains above levels it was at the end of 2016, even as the Empire Manufacturing report dropped to levels not seen since November.
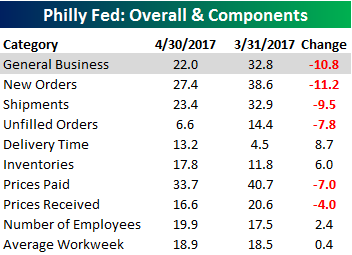 Breadth in this month’s report was also relatively weak, confirming the decline we saw in the headline reading. As shown in the table to the right, New Orders and Shipments both posted the largest declines, while the biggest increases came in Delivery Times and Inventories.
Start a 14-day free trial to unlock all of Bespoke’s market analysis.
Apr 20, 2017
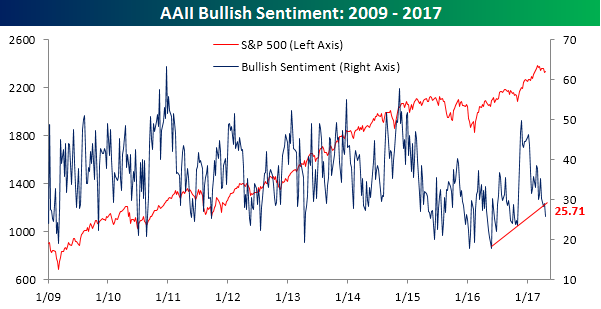
This shouldn’t come as a surprise to anyone, but as the market has come under selling pressure in the last several days, bullish sentiment on the part of individual investors has declined. According to the weekly AAII survey, bullish sentiment declined to 25.71% from 28.97%. That’s the lowest weekly print since the election and a record 120th straight week of sub-50% readings. Looking at the chart below, bullish sentiment has clearly broken its string of higher highs that had been in place since mid-2016.
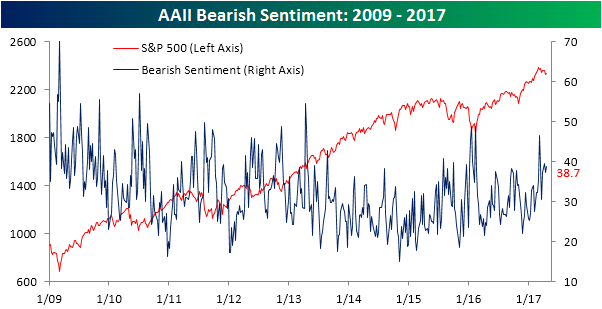
As bullish sentiment has declined, bearish sentiment has seen a small uptick, rising from 37.38% up to 38.70%. In this case, though, the chart of bearish sentiment doesn’t look nearly as significant as the chart of bullish sentiment shown above.
Start a 14-day free trial to unlock all of Bespoke’s market analysis.
Apr 19, 2017
Log-in here if you’re a member with access to the Closer.
Looking for deeper insight on global markets and economics? In tonight’s Closer sent to Bespoke Institutional clients, we take a look at weekly oil market data from the EIA as well as Gallup Weekly Economic Confidence.

The Closer is one of our most popular reports, and you can sign up for a free trial below to see it!
The Closer is one of our most popular reports, and you can see it and everything else Bespoke publishes by starting a no-obligation 14-day free trial to our research!