The Closer 7/25/16 – Texas Ticks Up As Oil Ticks Over
Looking for deeper insight on global markets and economics? In tonight’s Closer sent to Bespoke clients, we summarize a surprising jump in the Dallas Fed’s Manufacturing Activity Index that has Texas joining the rest of the nation in a manufacturing rebound. We also update technicals on a variety of asset classes including crude, gasoline, the USD, the ten year note, and gold.

The Closer is one of our most popular reports, and you can sign up for a trial below to see it and everything else Bespoke publishes free for the next two weeks!
Click here to start your no-obligation free Bespoke research trial now!
ETF Trends: US Indices & Styles – 7/25/16
Below is our daily list of the twenty best and twenty worst performing ETFs over the last five trading days. It was another tough day for commodities, as the stronger USD contributed to both the gold and oil ETFs’ drops. Turkey was up from Friday but still down on the week. The biotech stocks led the top performers once again and Hong Kong and India were the top regional exposures, although most of the top twenty performers had fairly modest gains on the week.

Bespoke provides Bespoke Premium and Bespoke Institutional members with a daily ETF Trends report that highlights proprietary trend and timing scores for more than 200 widely followed ETFs across all asset classes. If you’re an ETF investor, this daily report is perfect. Sign up below to access today’s ETF Trends report.
See Bespoke’s full daily ETF Trends report by starting a no-obligation free trial to our premium research. Click here to sign up with just your name and email address.
Chart of the Day – Equities and Credit Hang In Despite 16% Decline in Crude
This content is for members onlySummer Swoon at the Pump
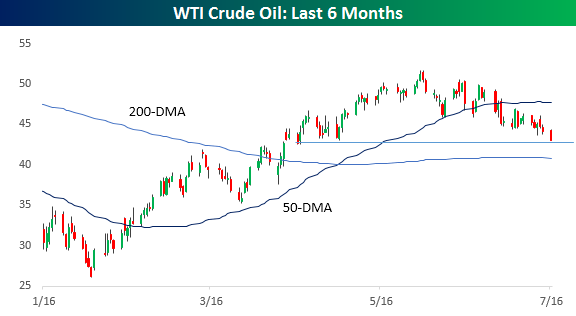
Since crude oil’s recent highs in early May, the commodity has been under steady pressure with a series of lower highs and lower lows on a short term basis. Today, the price of front-month WTI futures dropped below $43 and is now testing potential support at the low end of its range since its mid-April break out. Crude oil and equity prices have been closely correlated since earlier this year, and while correlations don’t go on forever, the fact that crude oil is stumbling is a short-term worry.
 One positive impact of the swoon in crude is that gas prices have been falling fast. Since Memorial Day, the national average price of a gallon of gas has declined by 6.9%. The table to the right shows the average change in prices from Memorial Day through 7/24 for each year since 2005, and this year’s decline ranks as the second steepest decline of any summer behind only 2007’s drop of 8.3%. Normally, prices are relatively flat in the summer months, so this year’s decline is not the norm.
To show this another way, the chart below compares the year to date daily change in average prices at the pump in 2016 compared to a composite chart of all years since 2005. Normally, prices tend to rally in the early months of the year, then peak and level off around Memorial Day, before a late-year decline post-Labor Day. This year, though, rather than levelling off for the summer, prices have cratered.
