Uncanny Consistency (To the Downside) In GDP
 Today’s Advance GDP for the second quarter came in weaker than expected at less than half of the consensus forecast (1.2% vs 2.6%). If you follow how economic data regularly comes in relative to expectations, today’s weaker than expected print should come as no surprise. The table to the right is from our Economic Indicator Database and shows the actual (unrevised) versus estimated Advance GDP print for every quarter of the current economic expansion. As shown in the table, Friday morning’s GDP print was the seventh straight weaker than expected report. In other words, the last time one of these reports surpassed expectations was in October 2014.
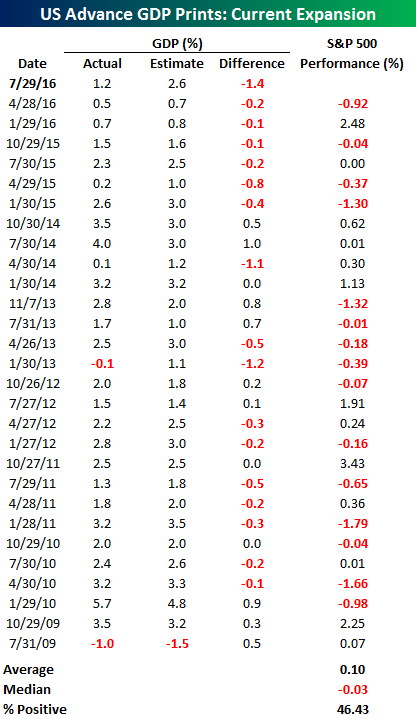
Overall, the record for Advance GDP prints during the current recovery isn’t much better. In the 29 quarterly Advance GDP reports since the second half of 2009, only nine have been better than expected, while 20 have missed the mark – that’s more than two-thirds of the time! In terms of the equity market’s reaction to Advance GDP reports, there hasn’t been a clear trend. Overall, the S&P 500 has averaged a gain of 0.10% (median: -0.03%) with positive returns a little less than half of the time.
The Closer 7/28/16 – GDP Trading Down, Homeownership Out
Looking for deeper insight on global markets and economics? In tonight’s Closer sent to Bespoke clients, we preview tomorrow’s GDP report with a review of the slide in the Atlanta Fed’s GDPNow forecast. We also discuss fresh data today from the US Census on the American housing market and real yields.

The Closer is one of our most popular reports, and you can sign up for a trial below to see it and everything else Bespoke publishes free for the next two weeks!
Click here to start your no-obligation free Bespoke research trial now!
ETF Trends: International – 7/28/16
Below is our daily list of the twenty best and twenty worst performing ETFs over the last five trading days. Natural gas has lurched higher over the last week while anything tied to industrial metals has performed well. Turkey has gotten a big bounce in the wake of the recent coup attempt, while Homebuilders were also surprisingly strong. Oil continues to get hit as oil-linked ETFs are near the bottom in terms of performance. Oil-linked economies like Norway have also started to slide, as have solar stocks.

Bespoke provides Bespoke Premium and Bespoke Institutional members with a daily ETF Trends report that highlights proprietary trend and timing scores for more than 200 widely followed ETFs across all asset classes. If you’re an ETF investor, this daily report is perfect. Sign up below to access today’s ETF Trends report.
See Bespoke’s full daily ETF Trends report by starting a no-obligation free trial to our premium research. Click here to sign up with just your name and email address.
Bespoke’s Sector Snapshot — 7/28/16
We’ve just released our weekly Sector Snapshot report (see a sample here) for Bespoke Premium and Bespoke Institutional members. Please log-in here to view the report if you’re already a member. If you’re not yet a subscriber and would like to see the report, please start a 14-day trial to Bespoke Premium now.
Below is one of the many charts included in this week’s Sector Snapshot, which shows the percentage of stocks in each sector trading above their 50-day moving averages. Overall, breadth levels are very healthy, with 75% of all S&P 500 stocks above their 50-days. Most cyclical sectors have readings even stronger than 75%, but as you’ll notice in the chart, there’s one standout on the downside — Energy.
To see our full Sector Snapshot with additional commentary plus six pages of charts that include analysis of valuations, breadth, technicals, and relative strength, start a 14-day free trial to our Bespoke Premium package now. Here’s a breakdown of the products you’ll receive.
