Jul 19, 2016
If you’re a regular follower of the market, you know that stock price reaction is ultimately what determines whether an earnings report is positive or negative. A company can beat earnings and sales estimates but trade down 10% on the day due to something the CEO said on its conference call. Basically if the stock goes up on the first trading day following its quarterly earnings report, investors treat the report as a positive one. If the stock goes down, it’s treated as a negative report. At Bespoke, we’ve been tracking the one-day price reactions for all stocks that report earnings for the last 15 years! All of this data is included in our Interactive Earnings Report Database (available at the Bespoke Institutional level).
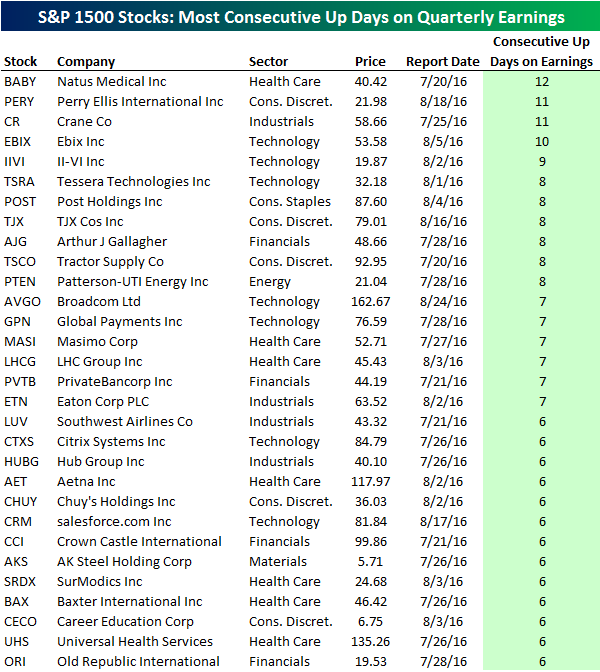
Earnings can obviously be hit or miss, but some stocks out there have been batting 1.000 for the last couple of years. In fact, there’s one stock in the S&P 1500 that has traded higher in reaction to its quarterly earnings reports for the last three years! That stock is Natus Medical (BABY), which has gone up on its last 12 quarterly earnings reaction days. You can see this amazing winning streak by clicking on the thumbnail image below. It’s a snapshot of the ticker “BABY” pulled up in our earnings database.

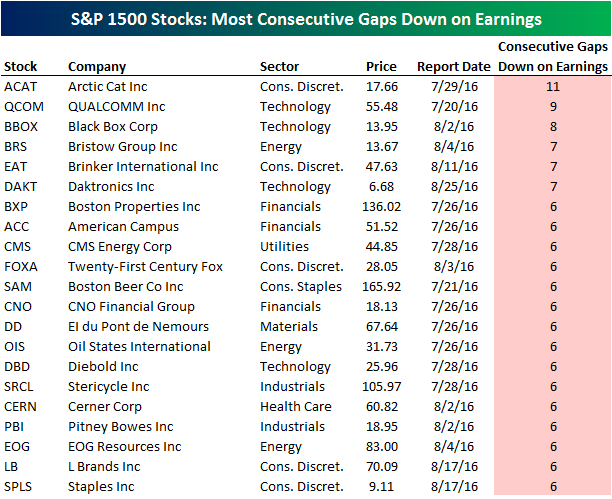
Along with BABY, there are 10 other stocks in the S&P 1500 set to report earnings between now and the end of August that have gone up on every quarterly earnings report day over the last two years. There are another 19 that have gone up on each of their last six earnings reaction days. All of these stocks are listed in the table below. Perry Ellis (PERY) and Crane (CR) are right behind BABY with 11 straight up days on earnings. Ebix (EBIX) has been up 9 quarters in a row, while TJX (TJX), Tractor Supply (TSCO), and Petterson-UTI Energy (PTEN) are a few of the names up 8 quarters in a row. Other notables on the list include Broadcom (AVGO), Southwest Air (LUV), Aetna (AET), salesforce.com (CRM), and AK Steel (AKS).
If you’re looking for earnings season winners, these stocks have been certainly been knocking it out of the park recently. That being said, because they’re on such long winning streaks, any weakness in their upcoming earnings reports will likely not be treated kindly by traders.
Jul 19, 2016
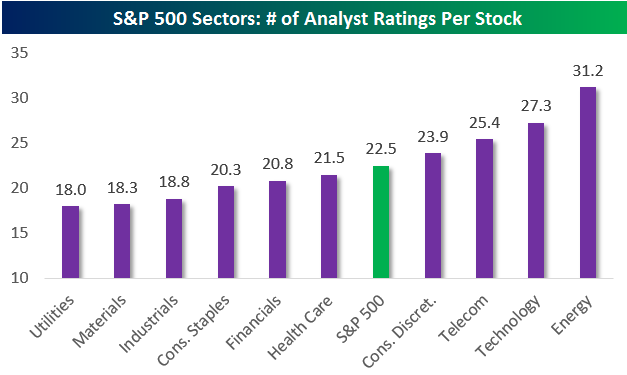
Earlier today, we sent out our bi-annual update of the most loved and hated stocks and sectors to Bespoke Premium and Bespoke Institutional members. This six-page report breaks down the 11,000+ analyst ratings for stocks in the S&P 500. Below is a look at the average number of analyst ratings for stocks in each sector of the S&P 500. As shown, the Energy sector is the most widely covered by Wall Street analysts, while Utilities is the least covered. If you’re looking to find stocks with the highest percentage of Buy and Sell ratings, or the stocks that have recently seen the biggest increases in Buy and Sell ratings, be sure to check out this report!
See the full B.I.G. Tips report by signing up for a monthly Bespoke Premium membership now. Click this link for a 10% discount ($89/month).
Jul 19, 2016
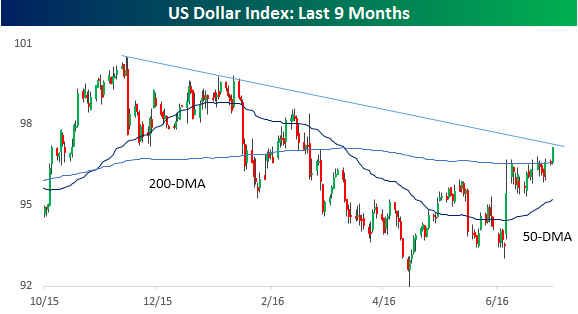
Following the June 23rd UK referendum where Brits voted to leave the EU, the US Dollar Index saw an initial spike of over 2%. That rally took the index right up to its 200-DMA, which is a level that it had been trading beneath since early March. Following that initial post-Brexit spike, though, the Dollar Index couldn’t quite muster the strength to take out its 200-DMA and traded in a sideways range for more than three weeks. In a tweet yesterday, we noted that in addition to its 200-DMA, the Dollar Index was also testing its downtrend from the late 3015 highs.
Today, the US Dollar Index took out its first resistance level at the 200-DMA and is currently trading just below that downtrend line. If it can take out this resistance level in the next few days, just like it did with the 200-DMA today, it should set the stage for a continued run higher and validate the argument that investors around the globe are moving capital into the US as it acts as a safe haven on a relative basis.
Jul 19, 2016
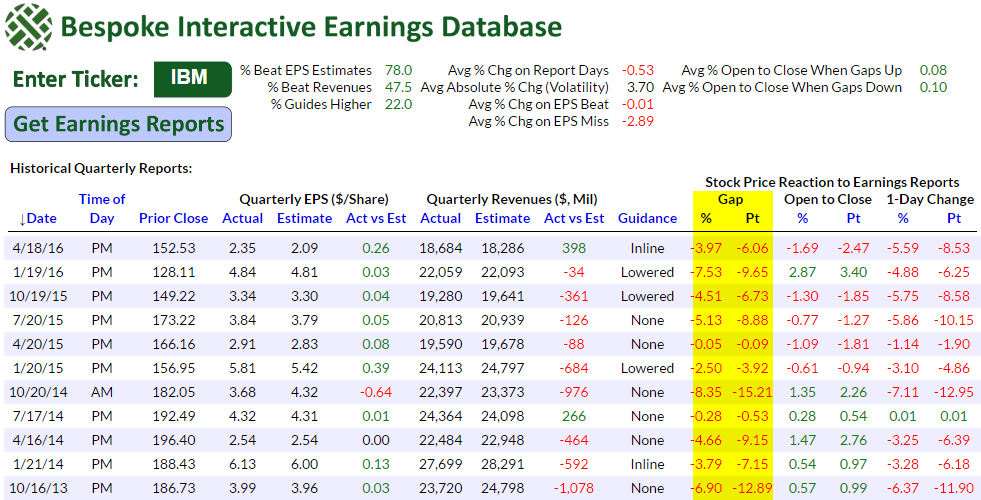
Coming into today, IBM had gapped down at the open of trading following its last 11 quarterly earnings reports! That’s an epic losing streak for a blue-chip company. You can see the streak by expanding the snapshot from our Interactive Earnings Report Database (available at the Bespoke Institutional level) below.

After noticing IBM’s earnings losing streak, we screened the universe of S&P 1500 stocks set to report EPS between now and the end of August to see if any other names are on similar streaks. Below is a list of the stocks that have opened lower in price following at least their last 6 quarterly reports. One other stock in the S&P 1500 has gapped down 11 quarters in a row — Arctic Cat (ACAT). Qualcomm (QCOM) has gapped down following its last 9 quarterly reports, while Black Box (BBOX) has gapped down 8 quarters in a row. Bristow Group (BRS), Brinker International (EAT) and Daktronics (DAKT) have all opened lower following their last 7 quarterly reports.