Jul 20, 2016
Crude oil inventories showed a larger than expected decline for the week, falling by 2.3 mln barrels versus consensus expectations for a draw of just 1.3 mln barrels. This was the ninth weekly decline in stockpiles, which is actually the longest string of weekly declines since at least 1983! The chart below shows weekly levels of crude oil inventories for 2016 and compares them to levels seen in 2015, as well as average levels over the last ten years and going back to 1983. Even with this week’s larger than expected decline in inventories, they remain well above average. Through the current week, inventory levels are 181 million barrels (50%) above average for this time of year.
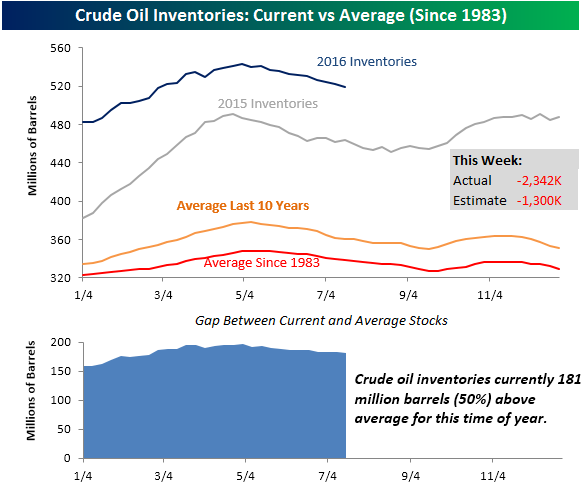
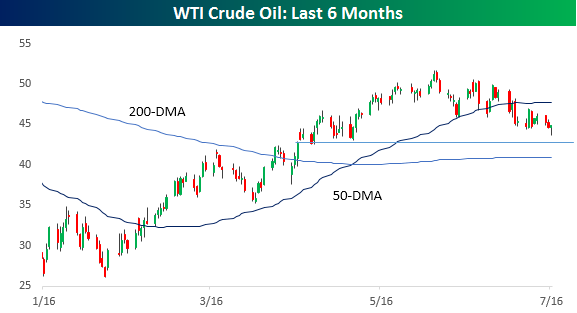
This morning’s news of a larger than expected decline in crude oil stockpiles has given a much-needed lift to oil prices, which earlier in the day touched their lowest levels since early May, and bounced right near potential support around $43.
Jul 19, 2016
Looking for deeper insight on global markets and economics? In tonight’s Closer sent to Bespoke clients, we do some digging into the types of bonds the ECB is buying as part of its corporate bond QE. We also look at fresh data on Eurozone bank lending, and go into deep detail on today’s Residential Construction report from the US Census, which included abnormally high conversions from Permits in May to Starts in June.

The Closer is one of our most popular reports, and you can sign up for a trial below to see it and everything else Bespoke publishes free for the next two weeks!
Click here to start your no-obligation free Bespoke research trial now!
Jul 19, 2016
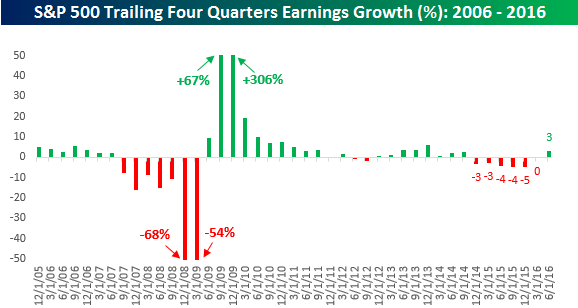 On a trailing one-year basis, as reported earnings for the S&P 500 have declined for six straight quarters, which is the longest streak since the Financial Crisis. Based on where analyst estimates currently stand, the S&P 500 is set to break that streak in the coming quarter.
In today’s Chart of the Day sent to paid subscribers, we looked at prior periods where the S&P 500 saw at least four quarters of earnings declines on a trailing one year basis, and then calculated the S&P 500’s performance during the streak and after. Sign up below for a free trial today to view.
Jul 19, 2016
Below is our daily list of the twenty best and twenty worst performing ETFs over the last five trading days. Turkey fell further, dropping over 12% on the week as uncertainty stemming from the failed coup attempt continued to permeate the markets. Oil and other energy exposures also performed poorly on the week though for the most part stayed stable from yesterday. The financial sector stocks as well as a number of regional exposures performed strongly on the week. Also notable is the outperformance of EM names like Brazil, Taiwan, and Poland.

Bespoke provides Bespoke Premium and Bespoke Institutional members with a daily ETF Trends report that highlights proprietary trend and timing scores for more than 200 widely followed ETFs across all asset classes. If you’re an ETF investor, this daily report is perfect. Sign up below to access today’s ETF Trends report.
See Bespoke’s full daily ETF Trends report by starting a no-obligation free trial to our premium research. Click here to sign up with just your name and email address.