Jul 20, 2016
Searching for ways to better understand the fixed income space or looking for actionable ideals in this asset class? Bespoke’s Fixed Income Weekly provides an update on rates and credit every Wednesday. We start off with a fresh piece of analysis driven by what’s in the headlines or driving the market in a given week. We then provide charts of how US Treasury futures and rates are trading, before moving on to a summary of recent fixed income ETF performance, short-term interest rates including money market funds, and a trade idea. We summarize changes and recent developments for a variety of yield curves (UST, bund, Eurodollar, US breakeven inflation and Bespoke’s Global Yield Curve) before finishing with a review of recent UST yield curve changes, spread changes for major credit products and international bonds, and 1 year return profiles for a cross section of the fixed income world.
This week, we took a look at which OIS forwards were most influential for the ten year US Treasury yield. We then looked at how the current Fed policy stance via forward guidance may be impacting the benchmark long-term bond yield. Our fixed income ETF spotlight this week focuses on income generation.

Our Fixed Income Weekly helps investors stay on top of fixed income markets and gain new perspective on the developments in interest rates. You can sign up for a Bespoke research trial below to see this week’s report and everything else Bespoke publishes free for the next two weeks!
Click here to start your no-obligation free Bespoke research trial now!
Jul 20, 2016
Below is our daily list of the twenty best and twenty worst performing ETFs over the last five trading days. The Turkish ETF continued to drop amidst uncertainty after the failed coup, maintaining its grip on the worst performer of the week. Gold exposures had a significant single day drop to render them all among the bottom 20 ETFs for the week, largely replacing the oil exposures which made modest gains today to drop off the list of bottom performers. Brazil and semiconductors were both up again, trading places for the top two spots. The biotech stocks also surged on the day.

Bespoke provides Bespoke Premium and Bespoke Institutional members with a daily ETF Trends report that highlights proprietary trend and timing scores for more than 200 widely followed ETFs across all asset classes. If you’re an ETF investor, this daily report is perfect. Sign up below to access today’s ETF Trends report.
See Bespoke’s full daily ETF Trends report by starting a no-obligation free trial to our premium research. Click here to sign up with just your name and email address.
Jul 20, 2016
The VIX Volatility index, otherwise known as the “fear gauge,” closed below 12 yesterday for the first time in just over a year. Below is a chart of the VIX going back to 1990, with green shading denoting sub-12 levels.

In today’s Chart of the Day sent to paid subscribers, we analyzed historically low readings for the VIX and how the equity market typically performs during these periods and beyond. Sign up for a free Bespoke research trial below to view today’s Chart of the Day.
Jul 20, 2016
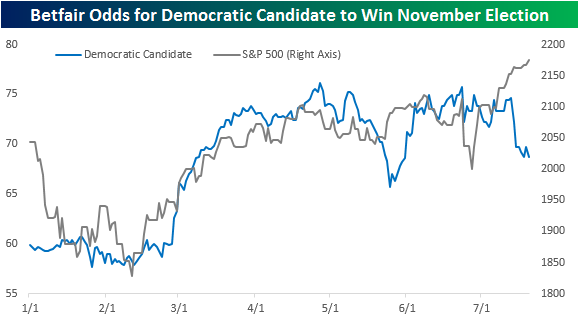
With the Republican National Convention fully underway, Donald Trump has seen quite a bounce in the betting markets regarding his chances of winning the November election. In the latest odds from the betting markets, Trump’s odds surpassed 30% for just the second time since he announced his candidacy over a year ago. At a level of 30.1%, his current odds are within one percentage point of his late May high (30.8%), when he all but locked up the nomination.
Oil tycoon Harold Hamm has chalked up the recent rally in equities to what he says is the market’s realization that, if elected, Donald Trump will be more friendly towards business. Whether you agree with his notion or not, there can be a case made that while the performance of equities had been closely tracking the poll numbers of Hillary Clinton, more recently, it has been Trump’s poll numbers that stocks have tracked.

Meanwhile, as the S&P 500 has surged, Clinton’s poll numbers have declined to their lowest level since late May. We have repeatedly highlighted the fact that history shows that equity markets have tended to do better under the administrations of Democratic presidents, but in the short term at least, Trump’s improving poll numbers have had zero impact on equity prices. That lack of a reaction may be due either to the fact that the betting markets have lost a lot of credibility post the 6/23 Brexit vote or that even after the recent shifts in the betting markets, Hillary Clinton’s chances of winning in November are still more than twice that of Donald Trump.