Jul 21, 2016
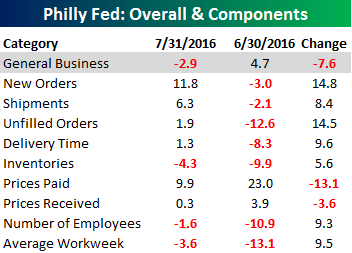 Manufacturing in the Philadelphia region unexpectedly weakened in the month of July as the Philly Fed report turned negative and missed expectations. While economists were forecasting a headline reading in the General Business Conditions Index of 4.5, the actual reading came in at -2.9, which was the lowest headline reading since January. Looking at the internals of the report, though, the picture was much less negative. As shown in the table to the right, the majority of components in the report were positive and showed improvement relative to June. New Orders, for example, saw a big jump, rising from -3.0 up to 11.8. The only three components that were negative this month were Inventories, Number of Employees, and Average Workweek, but even with the negative readings, all three showed improvement.

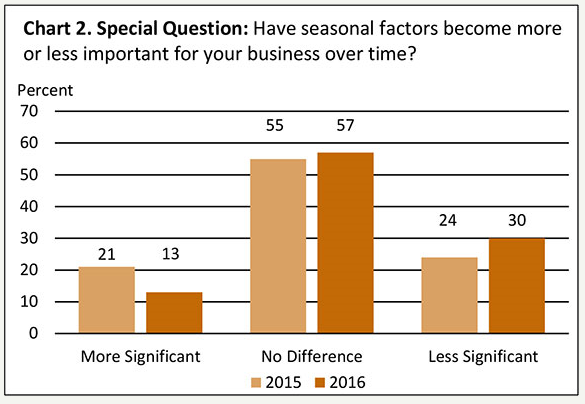
 One interesting aspect of this month’s report was a special question that the Philadelphia Fed asked respondents about seasonal factors and how they impact their business. There have been numerous times in the past few years where we have seen economic reports that either beat or wildly miss consensus expectations, and the culprit often cited is that seasonal adjustments skewed the results. This month’s special question suggests that seasonal factors may be less impactful to businesses than they have been in the past and would confirm that seasonal adjustments based on historical patterns may no longer be as applicable. As shown in the chart at right, when asked, “Have seasonal factors become more or less important for your business over time?”, the percentage of businesses that said “more significant” dropped from 21% down to 13%, while the percentage that said “less significant” increased from 24% up to 30%. This is just one data point in one region of the country, but it’s something to think about.
Jul 21, 2016
This week’s report on jobless claims came in lower than expected with another impressive reading. While economists were forecasting first-time claims to come in at a level of 265K, the actual reading came in 12K lower at 253K. This was the lowest weekly reading since April and is tied for the second lowest weekly reading of the current cycle. Just when you think claims have to start levelling off or rising, they start falling again!
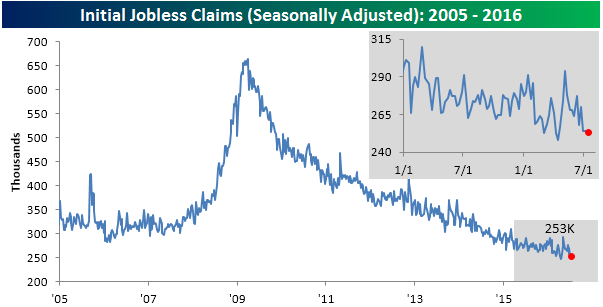
With three straight weeks of sub-260K readings, the four-week moving average is now within 2K of its multi-decade low of 256K. We thought it was extraordinary enough that the four-week moving average dropped as low as 256K back in April in the first place, but we honestly never thought it would get back down towards those levels again. If we see another reading like the last three next weeks, the four-week moving average will set another cycle low next week.

On a non-seasonally adjusted (NSA) basis, jobless claims came in at 269.2K. While we are used to noting that the weekly NSA reading is the lowest for the current week of the year going back to the early 1970s, this week’s reading was actually slightly higher than the same week last year. Relative to readings for the current week of the year dating back to 2000, though, this week’s level was nearly 150K below the 415K average, so it was hardly weak.
Jul 21, 2016
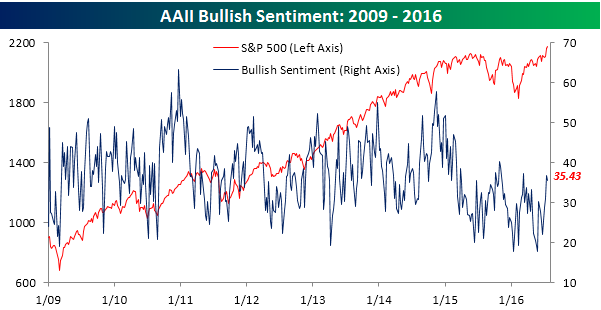
Despite the continued underlying bid in equities, individual investors still can’t get over the hump and push bullish sentiment back up above 40%. According to this week’s sentiment survey from AAII, bullish sentiment declined slightly, falling from 36.9% down to 35.4%. That makes this the 38th straight week where bullish sentiment has been below 40% and the 72nd time in the last 73 weeks that we have seen sub 40% levels of bullish sentiment.
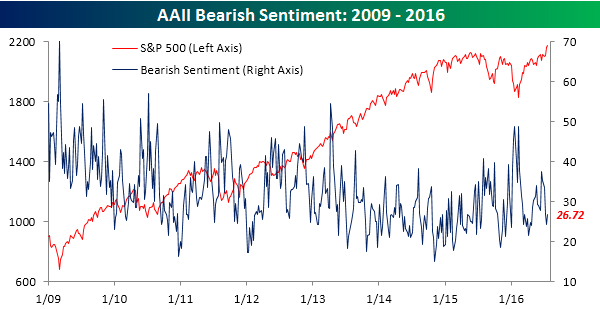
Bearish sentiment saw a modest uptick this week, rising from 24.4% to 26.7%. With stocks sitting comfortably at all-time highs, the fact that one-quarter of individual investors consider themselves bearish shows a general lack of complacency.
Jul 20, 2016
Looking for deeper insight on global markets and economics? In tonight’s Closer sent to Bespoke clients, we take a look at some turbulence in short-term interest rate markets driven, in our view, by regulatory reforms. We also continue to look at the VIX which made new lows today below 12.

The Closer is one of our most popular reports, and you can sign up for a trial below to see it and everything else Bespoke publishes free for the next two weeks!
Click here to start your no-obligation free Bespoke research trial now!
Jul 20, 2016
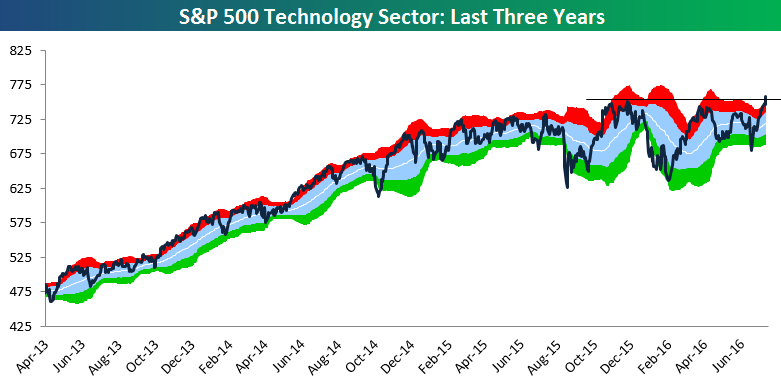
The S&P 500 Technology sector has a weighting of more than 20% in the S&P 500. If Tech is performing well, it’s likely that the broad market is performing well too. Over the last few weeks, Tech has led this market higher, and today the sector became the second cyclical sector — along with Industrials — to make a new bull market high. While it’s just one day still, this breakout to new highs for Tech is a positive for the market.
 One interesting aspect of this month’s report was a special question that the Philadelphia Fed asked respondents about seasonal factors and how they impact their business. There have been numerous times in the past few years where we have seen economic reports that either beat or wildly miss consensus expectations, and the culprit often cited is that seasonal adjustments skewed the results. This month’s special question suggests that seasonal factors may be less impactful to businesses than they have been in the past and would confirm that seasonal adjustments based on historical patterns may no longer be as applicable. As shown in the chart at right, when asked, “Have seasonal factors become more or less important for your business over time?”, the percentage of businesses that said “more significant” dropped from 21% down to 13%, while the percentage that said “less significant” increased from 24% up to 30%. This is just one data point in one region of the country, but it’s something to think about.