The Closer 7/22/16 – End of Week Charts
Looking for deeper insight on global markets and economics? In tonight’s Closer sent to Bespoke clients, we recap weekly price action in major asset classes, update economic surprise index data for major economies, chart the weekly Commitment of Traders report from the CFTC, and provide our normal nightly update on ETF performance, volume and price movers, and the Bespoke Market Timing Model.

The Closer is one of our most popular reports, and you can sign up for a trial below to see it and everything else Bespoke publishes free for the next two weeks!
Click here to start your no-obligation free Bespoke research trial now!
The BESPOKE Report – 7/22/16
It’s amazing how things can change in such a short period of time. Four weeks ago today, global markets were more chaotic than perhaps any other time since the Financial Crisis in 2008 in the aftermath of the Brexit referendum. On that day, every one of the 25 largest global benchmark indices we track that were open for trading were down on the day. The sell-off from that Friday followed through to the following Monday, and for the US it was an epic reversal in such a short period of time. In the span of two trading days, the S&P 500 went from 1.6 standard deviations above its 50-DMA to 3.2 standard deviations below. In the index’s entire history, there has never been a larger decline in the index’s OB/OS reading in that short a period of time.
As if that move wasn’t major enough, the rebound that followed was nearly as monumental. In the span of ten trading days, the S&P 500 went from 3.2 standard deviations below its 50-DMA to 2.5 above. That 5.7 point ten-day move in the index’s OB/OS reading was only eclipsed one other time in the S&P 500’s history, and that was 8/23/1982. If you know anything about market history, you know that August 1982 was a good time to get long equities.

So, how does the S&P 500 follow-up a twelve trading day period where it saw the most extreme two-day downside move and the second largest ten-day upside move? Like a little kid coming off a sugar high, volatility has seen an outright collapse. After closing above 25 on 6/24, the VIX closed below 12 this past Tuesday, marking the quickest decline from a 25+ reading down to a sub 12 reading on record. Welcome to the dog days of summer!
You’ve just read the introduction to this week’s Bespoke Report newsletter. You can read the entire thing by starting a 14-day free trial to our paid content below.
Have a great weekend!
ETF Trends: Fixed Income, Currencies, and Commodities – 7/22/16
Below is our daily list of the twenty best and twenty worst performing ETFs over the last five trading days. The biotech ETFs and semiconductors continued to rise to claim the top three spots. Healthcare providers also had a strong run the last five days. The Turkish ETF was up from yesterday, which makes it possible that it hit rock bottom, but with so much uncertainty surrounding the Turkish government and markets right now, it’s hard to definitely say that it’s bottomed out after a 15% decline versus a week ago. The gold and oil stocks both continued to fall on the day and on the week as oil trends lower. The Agricultural ETF has struggled all week but is stable as of yesterday. Hong Kong inched up and Poland inched down to remain the best performing regional exposures.

Bespoke provides Bespoke Premium and Bespoke Institutional members with a daily ETF Trends report that highlights proprietary trend and timing scores for more than 200 widely followed ETFs across all asset classes. If you’re an ETF investor, this daily report is perfect. Sign up below to access today’s ETF Trends report.
See Bespoke’s full daily ETF Trends report by starting a no-obligation free trial to our premium research. Click here to sign up with just your name and email address.
Best and Worst Stocks on Earnings This Season
So far this earnings season, the average stock that has reported has gained 0.27% on its earnings reaction day. (For companies that report before the open, its earnings reaction day is that day. For companies that report after the close, its earnings reaction day is the next trading day.)
Below is a list of the stocks that have gained more than 5% on their earnings reaction days this season. As shown, Boston Beer (SAM) is at the top of the list with a one-day gain of more than 18%. Allied World Assurance (AWH) ranks second with a gain of 15.8%, followed by Medidata Solutions (MDSO) at 14.66%. IMAX and Marvell (MRVL) round out the top five with one-day gains of just over 14%. Southwestern Energy (SWN) has been the top performing S&P 500 stock with a gain of 10.98%, followed closely by EBAY at +10.89%. Other notables on the list of earnings season winners include Biogen (BIIB), Qualcomm (QCOM), Alcoa (AA), and Microsoft (MSFT).

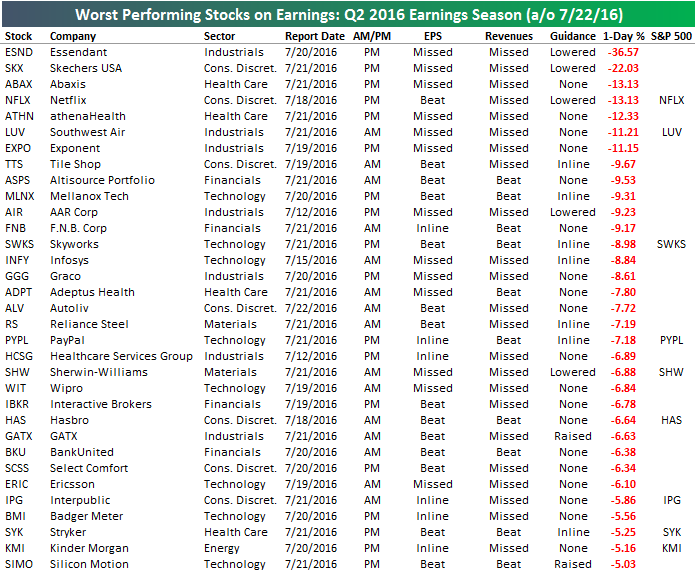
Essendant (ESND) has been the biggest loser on earnings so far this season with a one-day drop of 36.57%! Skechers (SKX) has been second worst at -22%, followed by Abaxis (ABAX) at -13.13%. Netflix (NFLX) has the unfortunate title of being the biggest loser in the S&P 500 so far this season with a decline of 13.13%. Other notables on the list of losers include Southwest Air (LUV), Skyworks (SWKS), Hasbro (HAS), and Kinder Morgan (KMI).