Nov 24, 2015
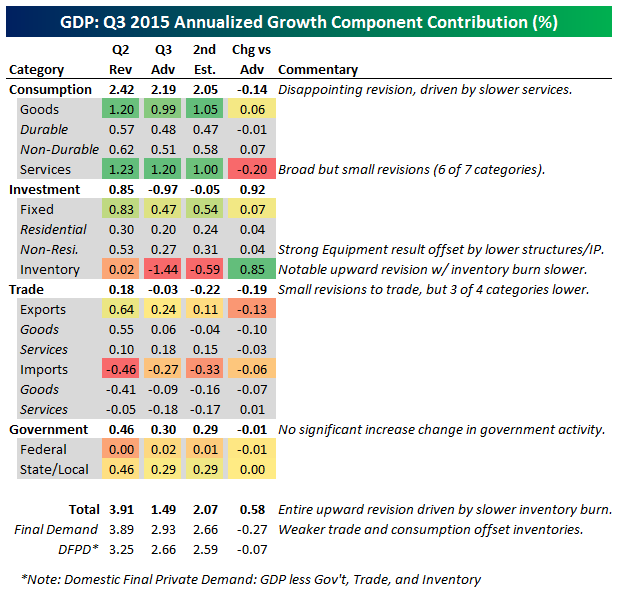
The Bureau of Economic Analysis just released Q3’s second reading on GDP, and while growth was revised up to 2.1% as expected, the report was negative for final demand as consumption was revised lower (driven primarily by services). Weaker trade also offset the large upward revision to inventories, which were responsible for the entire improvement of growth versus the advance estimate. It’s worth pointing out that while inventories contributed the entirety of the improvement from one estimate to another, they were still a net drag on growth for the quarter, as their negative impact was revised to a less negative figure. Our annotated table summarizing the release is below.
The Q3 data is now between 2 and 5 months old; GDP is an extremely lagging indicator. That said, we can definitely get some reading on what’s ahead for Q4 based on these numbers. Expect the inventory drag to continue in the medium term, but keep in mind that neither private investment nor consumption trends appear to be weakening materially. All said, the combined impacts of stronger dollar, weaker industrial activity, and a collapse in energy capex have had a very mixed impact on the US economy, with respectable consumption figures basically offsetting those negatives so far this year.
Nov 23, 2015
Looking for deeper insight on global markets and economics? In The Closer tonight we review a modestly disappointing start to the data week (including the chart below), and we cover today’s price action in detail.
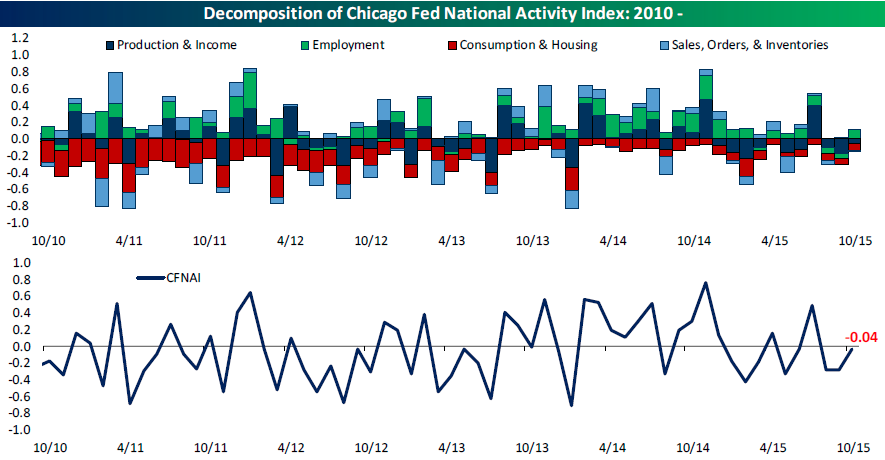
The Closer also includes its standard charts, large volume and price movers in the US equity market, and Bespoke’s Market Timing Model. The Closer is one of our most popular reports, and you can sign up for a trial below to see it free for the next two weeks!
[thrive_leads id=’58717′]
Nov 23, 2015
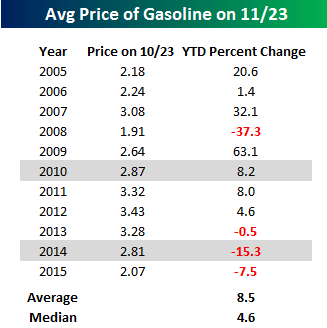 You don’t need this website to know that gas prices have been on the decline, but sometimes we can help put the decline into perspective. According to AAA, the national average price of a gallon of gas currently stands at $2.07. On a year to date basis, prices at the pump have dropped 7.5%, and since 2005, this is the fourth time that prices have been in the red on a YTD basis through 11/23. The only other year that prices have been this low at this time of year was in 2008, which was during the depths of the financial crisis in 2008.
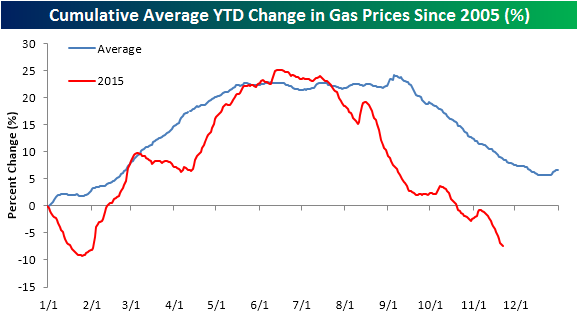
The chart below compares the trend in gasoline prices so far in 2015 to the ‘average’ annual pattern going back to 2005. Despite the fact that prices are down a lot more than normal for this time of year, the pattern for 2015 has pretty much followed the typical seasonal pattern of rising in the first half of the year and falling in the second half. If this pattern continues to hold, prices should continue to decline through mid-December. Between now and then, the national average price typically declines by about 3.3%, so if we were to get that type of average decline this year it would put the average price at $2.02 per gallon. It’s not quite a 1 handle, but it’s close!
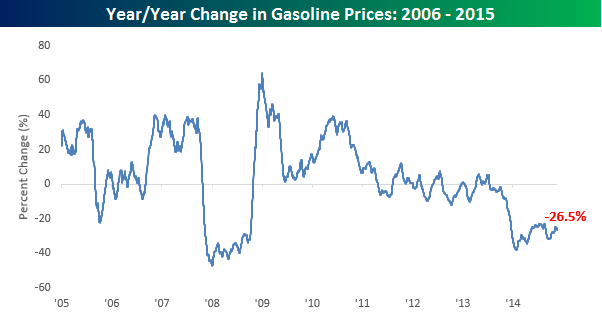
Finally, the chart below shows the y/y change in the national average price of gasoline going back to 2006. As shown, compared to last year, the national average price is down nearly 27%, which is off the lows, but still depressed from a historical perspective. This depressed y/y reading, however, tells only half the story. Not only are prices down y/y, but they have also been that way for quite a long period of time. As of today, the y/y price has been negative for 502 calendar days, which far exceeds the 368-day streak of negative y/y prices in 2008 and 2009. Additionally, at a current level of -26.5%, gas prices have been down more than 20% y/y for 352 calendar days, or seven days longer than the 345-day streak we saw during the financial crisis. So we are actually getting to the point where gas prices are down 20%+ from levels last year that were down 20%+ from the year before. After a while that really starts to add up!
Nov 23, 2015
In today’s Chart of the Day available to Bespoke subscribers, we take a look at seasonality trends for two package shipping companies — FedEx (FDX) and UPS. Both companies benefit from the huge “bricks to clicks” trend going on in retail right now. With the holiday shopping season upon us, we analyzed whether it is smart or not to get long the two biggest shippers of all these holiday goods.
To continue reading our Chart of the Day, enter your info below and start a free Bespoke research trial. During your trial, you’ll also receive access to our model stock portfolios, daily market alerts, and weekly Bespoke Report newsletter.
[thrive_leads id=’59052′]