The Closer 11/25/15 – “Weak Data Ahead of Turkey Day”
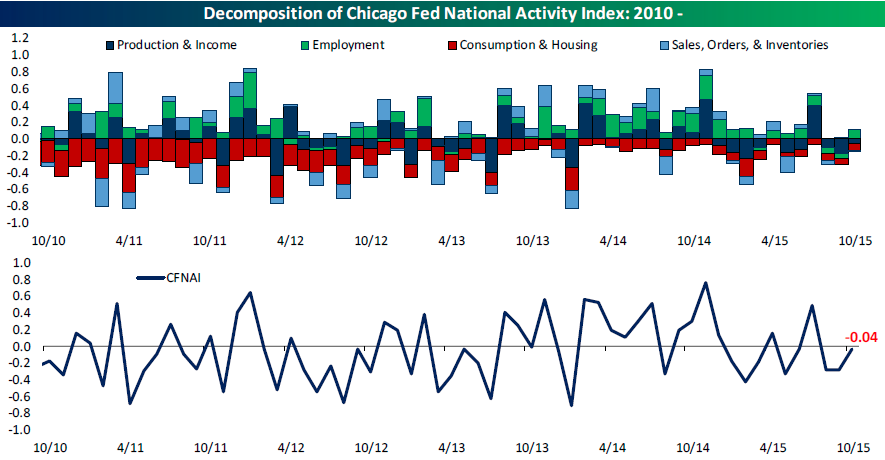
Looking for deeper insight on global markets and economics? In The Closer tonight we spend several pages looking at key economic indicators for the fourth quarter, including October manufacturing output, consumption spending, and new home sales. Below is a preview, which shows one of the weaker points we saw. For more on why this might not be something to be too worried about, sign up for a free trial for access below.
The Closer also includes its standard charts, large volume and price movers in the US equity market, and Bespoke’s Market Timing Model. The Closer is one of our most popular reports, and you can sign up for a trial below to see it free for the next two weeks!
[thrive_leads id=’58717′]FANG Charts
CNBC’s Jim Cramer has popularized the “FANG” acronym recently, which stands for Facebook (FB), Amazon.com (AMZN), Netflix (NFLX) and Google (GOOGL). These four stocks have certainly done well in 2015, but below we wanted to show readers long-term charts of each one going back to 2009 (and 2012 in the case of FB).
Facebook (FB) is the youngest of the “FANG” quartet. After struggling mightily in its first year as a public company, the stock has surged since its mid-year earnings report in 2013 when the company finally proved that it could actually make money in the mobile space. The stock has been in a well-defined uptrend channel since the start of 2014, and just recently it broke over the top of this channel.

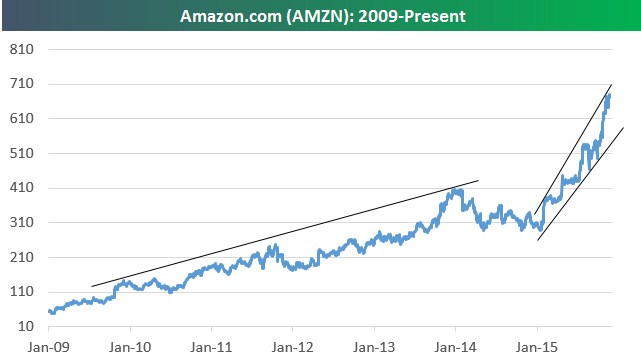
Amazon.com (AMZN) has baffled fundamental investors for years, as it has charged higher and higher and higher while never actually generating profits. Since its lows in early 2009, the stock has been a “10-bagger”, gaining more than 1,000% (10x) to its current share price of $675. In 2015, though, the stock has gone parabolic, which as we all should know can’t last forever.
While AMZN is up more than 1,000% since 2009, Netflix (NFLX) is up more than 1,500% since late 2012! As shown below, this stock was trading under $10/share (split-adjusted) as recently as September 2012, and now it’s above $120. The stock stumbled a bit a couple of months ago, but it has managed to bounce back and is in the process of re-testing its prior all-time highs. If it’s able to break out to new highs, shareholders will breathe a sigh of relief. If it can’t break out, a dreaded “double-top” just might be forming.

The “G” in “FANG” stands for GOOGL, which had to go and change its company name to Alphabet, Inc. earlier this year. The name change (accompanied by a re-structuring) has proven to be bullish for the stock, as we’ve seen a huge move from $550 up to $770 over the last four months. Back in July, investors had begun to call GOOGL dead money after it trended sideways over the prior 18 months. Now the stock does nothing but hit new all-time highs by the day. While the long-term trend is once again higher, we wouldn’t be surprised to see a move back into its old channel at some point in the next few months.

Chart of the Day – 11/25/15
In today’s Chart of the Day available to Bespoke subscribers, we take a look at market breadth for the S&P 500 Industry Groups and how it compares to prior years.
To continue reading our Chart of the Day, enter your info below and start a free Bespoke research trial. During your trial, you’ll also receive access to our model stock portfolios, daily market alerts, and weekly Bespoke Report newsletter.
[thrive_leads id=’59052′]