The Closer 11/30/15 – “Inherently Messy Function”
Looking for deeper insight on global markets and economics? In The Closer tonight we focus on the decision to include the Chinese yuan in the IMF’s Special Drawing Rights basket.
The Closer also includes its standard charts, large volume and price movers in the US equity market, and Bespoke’s Market Timing Model. The Closer is one of our most popular reports, and you can sign up for a trial below to see it free for the next two weeks!
[thrive_leads id=’58717′]November and YTD Asset Class Performance
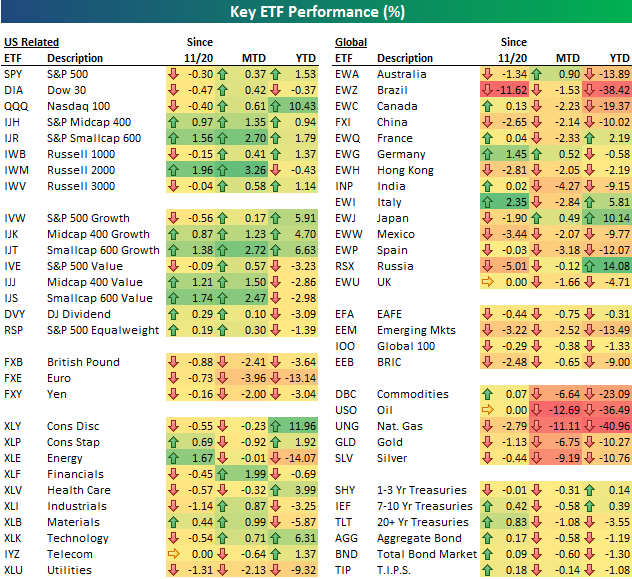
The final month of the year is now upon us, but before thinking about December, let’s recap what happened across asset classes in November. Below is our matrix of key ETFs that highlights the recent performance of domestic and international equities, currencies, commodities and fixed income. For each ETF, we show its performance since the close on 11/20, during the month of November, and year-to-date through November.
As shown, small-cap and mid-cap ETFs have done very well over the last ten days, and they outperformed for the month as well. The Russell 2,000 (IWM) ETF gained 3.26% in November versus a gain of just 0.37% for the S&P 500 (SPY). Looking at the ten U.S. sectors, Financials (XLF) did the best in November with a gain of 1.99%, followed by Materials (XLB), Industrials (XLI) and Technology (XLK).
Outside of the U.S., just three of the country ETFs featured gained in November — Australia (EWA), Germany (EWG) and Japan (EWJ). India (INP) fell the most with a decline of 4.27%. For the year, Russia (RSX) remains the big winner at +14%, while Brazil (EWZ) is down by far the most at -38.4%.
Commodities were crushed in November, with oil (USO) and natural gas (UNG) leading the way lower. Gold (GLD) and silver (SLV) both fell sharply as well. And while Treasury ETFs have bounced back since last Monday, they were down across the board for the month.
B.I.G. Tips – December Seasonality + Market Calendar
This content is for members onlyChart of the Day – 11/30/15
In today’s Chart of the Day available to Bespoke subscribers, we look at the intra-month performance of the S&P 500 during the month of December and how recent performance compares to longer-term trends.
To continue reading our Chart of the Day, enter your info below and start a free Bespoke research trial. During your trial, you’ll also receive access to our model stock portfolios, daily market alerts, and weekly Bespoke Report newsletter.
[thrive_leads id=’59052′]