Dogs of the Dow Performance So Far in 2020
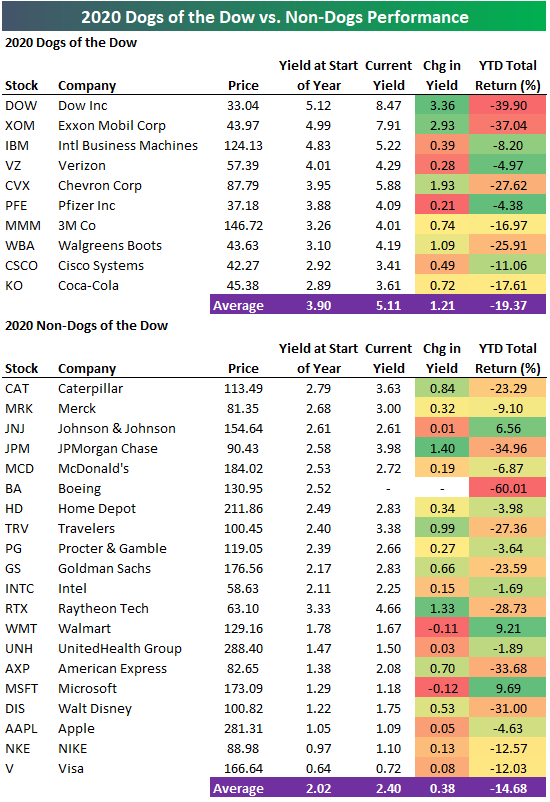
The average stock in the Dow Jones Industrial Average is down 16.24% on a total return basis so far in 2020. Below we take a look at how the “Dogs of the Dow” strategy has performed so far this year.
The “Dogs of the Dow” strategy is a very passive approach that simply says to buy the 10 stocks in the Dow 30 that have the highest dividend yields at the start of each year. The Dogs list for 2020 was led by Dow Inc. (DOW) with a yield of 5.12% on January 1st. Exxon Mobil (XOM), IBM, Verizon (VZ), Chevron (CVX), Pfizer (PFE), 3M (MMM), Walgreens (WBA), Cisco (CSCO), and Coca-Cola (KO) are the nine other members of the Dogs for 2020.
As shown in the table below, the Dogs are down an average of 19.37% on a total return basis in 2020, which is a little less than five percentage points worse than the 14.68% decline seen for the 20 non-Dogs this year. Dow Inc. (DOW) and Exxon Mobil (XOM) have been the two worst performing Dogs with respective YTD declines of 39.9% and 37.0%. Dow’s dividend yield has risen from 5.12% up to 8.47%, while XOM’s yield has risen from 4.99% up to 7.91%. There are no Dogs that are up on the year, but Verizon (VZ) and Pfizer (PFE) have been the best performers of the group with YTD declines of less than 5%.
Of the non-Dogs, Boeing (BA) has been by far the worst performer with a YTD decline of 60.01%. At the start of 2020, BA had a dividend yield of 2.52%, but that dividend has been suspended. JP Morgan (JPM), American Express (AXP) and Disney (DIS) have all fallen more than 30% YTD, while Johnson & Johnson (JNJ), Walmart (WMT), and Microsoft (MSFT) are the only three Dow stocks that are up on the year. Read our weekly Bespoke Report newsletter released every Friday with a two-week free trial to Bespoke Premium.
Investors Giving Companies a Pass on Earnings So Far
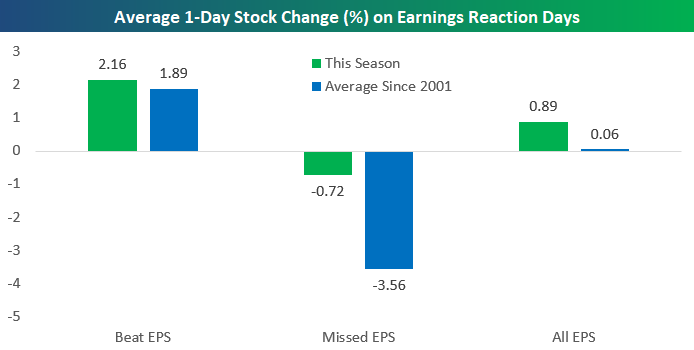
We’re now two weeks into the Q1 2020 earnings season, and just over 200 companies have reported their numbers so far. The average one-day price change for the stocks that have reported earnings so far this season has been a gain of 0.89%. That’s much stronger than the average one-day gain of 0.06% seen for all stocks that have reported earnings since 2001.
As shown below, stocks that have beaten EPS estimates this season have averaged a one-day price gain of 2.16% on their earnings reaction days. That’s stronger than the average one-day gain of 1.89% seen on earnings reaction days for all stocks that have reported since 2001. Stocks that have missed EPS estimates this season have seen a one-day decline of 0.72% on their earnings reaction days. Historically, the average stock that has missed EPS has fallen 3.56% on its earnings reaction day, so this season’s decline of just 0.72% suggests that investors are basically giving a pass to companies missing estimates in Q1. Read our weekly Bespoke Report newsletter published every Friday with a two-week free trial to Bespoke Premium.
Next Week’s Economic Indicators
Even though most economic data releases this week that had forecasts exceeded those estimates (10 of 15), data continues to come in very weak. The Chicago Fed’s National Activity index started off the week coming in at –4.19 which was well below estimates of –3. Existing home sales followed up on Tuesday, and despite coming in above estimates, sales slowed considerably from February. Elsewhere in housing data, new home sales collapsed down to 627K SAAR compared to 765K last month. Meanwhile, February home prices showed some acceleration. Jobless claims also were better than expected, but they too remain at extremely elevated levels relative to the rest of history. Manufacturing data was a major area of weakness this week. Both the preliminary Markit PMI and Kansas City Fed reading fell significantly despite coming in better than forecast. Hard manufacturing data on Friday was likewise bad at the headline level though under the hood there were some silver linings.

Turning to next week, like the earnings calendar, the economic calendar ramps up with a total of 34 releases. We will get the final two regional Federal Reserve indices from Dallas and Richmond on Monday and Tuesday, respectively, followed by the final Markit and ISM reading for April on Friday. Wednesday will be the most closely watched day of the week with the first release of Q1 GDP as well as an FOMC rate decision. Growth in the first quarter is expected to show a 3.8% contraction. Although no change in rates is being forecast, Fed Chair Powell’s following presser will likely be closely watched for a monetary policy update. Start a two-week free trial to Bespoke Institutional to access our interactive economic indicators monitor and much more.

Biggest Companies Reporting Earnings Next Week (AAPL, AMZN, MSFT and More)
The earnings calendar has begun to ramp up over the past two weeks and over the next two weeks we will see peak earnings season. Next week there are a total of 784 companies scheduled to release earnings. Of those, there are 178 S&P 500 stocks, which is 35.% of the index.
In the table below we show the 30 largest stocks (by market cap) that are scheduled to report next week. None of the largest stocks report on Monday, but the two Dow pharmaceutical stocks, Merck (MRK) and Pfizer (PFE), kick things off Tuesday morning. The trillion dollar market cap club will all report next week with Microsoft (MSFT) out with earnings Wednesday night and Apple (AAPL) and Amazon (AMZN) out the following evening. Two other notable releases Wednesday and Thursday, respectively, will be the major payment processors Visa (V) and Mastercard (MA). Friday will be capped off with two oil giants: Exxon Mobil (XOM) and Chevron (CVX). Other honorable mentions not on this list reporting next week include industrial bell-weather Caterpillar (CAT), stocks likely benefiting from the COVID economy like Colgate Palmolive (CL) and Clorox (CLX), and finally, some travel and leisure stocks like Expedia (EXPE), Royal Caribbean (RCL), United Airlines (UAL), and Southwest Airlines (LUV). Keep track of all upcoming earnings with our Earnings Explorer. Start a two-week free trial to Bespoke Premium to access Earnings Explorer tool and more.

US Aircraft Order Cancellations Dwarf New Orders
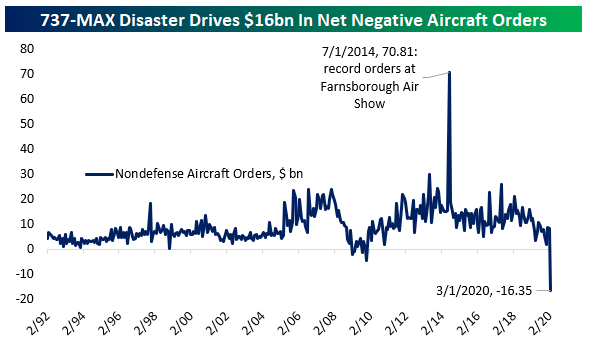
Today’s preliminary report on manufacturers’ new orders, sales, and inventories was mixed, with a huge headline drop but stronger results under the hood…especially relative to disastrous manufacturing sentiment series in March and April. Leaving aside the broader implications of the report, we wanted to highlight one series in particular. With Boeing (BA) reeling from the ongoing problems with its 737-MAX design and the global shock to its customers in the form of COVID-19, the US aerospace industry is under immense pressure. Things are so bad that orders are being canceled faster than new orders are placed. That situation is not without precedent; it applied for a stretch in 2008-2009 as well. But the scale of net negative order growth is much, much larger this time around. Across all US manufacturers in March, $16.35bn more orders were canceled than new orders received. Start a two-week free trial to Bespoke Institutional to access our Chart Scanner, custom screens, and much more.
Gold Bounces Right Where It Was Supposed To
With central banks around the world unleashing waves of liquidity, there have been heightened concerns that one result will be a decline in the purchasing power of our money. For that reason, a number of investors have been flocking to gold. Even before the COVID-19 crisis, gold prices had been in a solid uptrend, and while prices spiked as the crisis first began, they couldn’t quite get above the $1,650 – $1,700 range. In mid-March even, prices plummeted with just about every other financial asset before quickly recovering. Once again, though, the rally stalled at resistance. This time around, though, the 50-day moving average was strong enough to provide support and after that test, gold finally got the long-awaited breakout that investors had been waiting for.
Gold’s price spiked as high as $1,787 per ounce in mid-April before running out of momentum. When a stock or commodity breaks out above resistance to new highs and then pulls back, the former resistance level should act as support, and that is exactly what we saw this time around. This week, gold bounced right on cue at around $1,700 and has since rallied 2.6%. With the first test of support proving successful, look for gold to now establish a new range with a floor at around $1,700. At least that’s what the technical analysis textbooks would say. Start a two-week free trial to Bespoke Institutional for access to our entire suite of market research and commentary.

Chart of the Day: Tenacity Required With Tenneco
Half of Investors Bearish Again
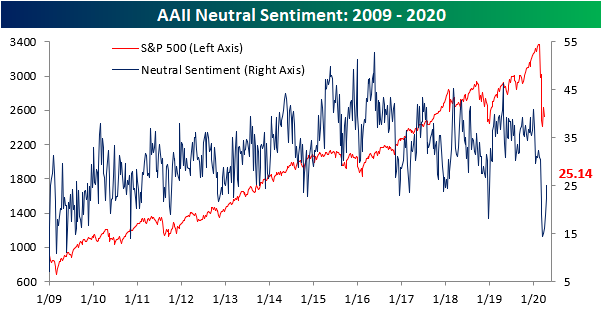
Heading into today’s session, the S&P 500 was little changed over the past week. But even if equity prices are not reflecting it, the decimation of the crude oil market has put a dent in investor sentiment. In this week’s AAII survey, only 24.86% of investors responded as bullish. That is the lowest level of bullish sentiment since the COVID-19 outbreak began! The last time the bullish reading was this low or lower was on October 10th when it was 20.31%. The 10 percentage point decline from last week’s reading of 34.86% was also the largest weekly decline since February 27th.

Whereas bullish sentiment fell, bearish sentiment rose to 50%. This is the first time since the final week of March that at least half of respondents reported as bearish, and it was the biggest jump in bullish sentiment since March 12th. The inverse moves of bullish and bearish sentiment this week has also sent the bull-bear spread to its widest level in favor of bears since last August. Today, the bull-bear spread is at -25.14. At its widest level back in early August is was slightly wider at -26.54. This week also marked the first time since April of 2013 that bearish sentiment doubled bullish sentiment.

Recently, neutral sentiment has been extremely muted. At its low in mid-March, neutral sentiment was only at 14.5%. Every week since then, neutral sentiment has ground higher reaching over 25% this week for the first time since late February. Start a two-week free trial to Bespoke Institutional to access our interactive economic indicators monitor and much more.
Another Week, Another Massive Jobless Claims Number
A massive number of people continue to file jobless claims with another 4.427 million initial jobless claims coming in this week. Similar to last week, the good news is that was less than forecasts of 4.5 million and the 4.427 million number is a drop from the 5.237 million last week. In fact, that 810K decline is the second largest on record behind last week’s 1.378 million drop. Additionally, this week was the lowest print since the first claims number above 1 million for the week of March 20th. The bad news is that regardless of the somewhat slowed pace on initial jobless claims, the numbers remain at historically unprecedented levels.

Before seasonal adjustment, this week saw 4.267 million claims filed compared to 4.965 million last week. Again, while that number is still extremely high, the past two weeks have marked a significant deceleration.
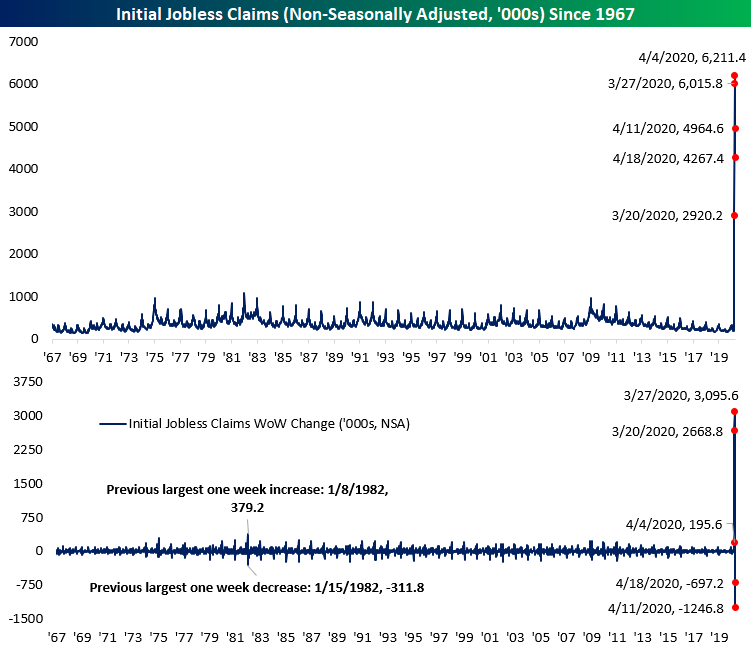
While the level of claims are off of their records from a few weeks ago, the moving average put in a new record high today. The moving average has continued to grind higher reaching 5.786 million. Granted, that 280K increase from last week was the smallest since the surge in claims began in late March.

As previously mentioned, the pace of initial jobless claims have slowed for the time being, but that does not take away from the massive number of people reporting as jobless. In total, since the beginning of March, just under 27 million Americans, or roughly 8% of the population, have filed initial jobless claims (seasonally adjusted). Although they are released with a one week lag to initial jobless claims, continuing claims this week printed at their highest level on record at 15.976 million. Start a two-week free trial to Bespoke Institutional to access our interactive economic indicators monitor and much more.

Gauging the Global Bounce
The US (S&P 500) has managed to quickly re-enter a bull market after the 33.92% decline from 2/19 to 3/23 that brought the post-Financial Crisis bull market to an end. Today, the S&P is now 17.45% below the 2/19 high after rallying nearly 25% since 3/23. As shown in the table below, of the 23 countries in our Global Macro Dashboard, that is the third best rally off of its respective low. Only South Africa and South Korea have rallied more off of their 2020 low on 3/19; a few days before the US bottom. Around half of these countries found a bottom on the same day as the US, 3/23, while the rest were a few days earlier. Italy was the first to bottom on March 12th. But as for the 2020 equity market highs, the US peaked alongside Canada and multiple European countries later than other global economies. For example, South Korea, South Africa, Taiwan, Korea, Russia, Japan, the UK, and Hong Kong all peaked back in January.

As for longer term trends, below we provide 10-year price charts (in local currency) of the major stock market indices for the countries listed in the table above. The Covid market crash in the first quarter broke significant long term uptrend channels that were in place for the majority of countries. The only countries that have managed to somewhat hold onto long-term uptrends are China, Hong Kong, Norway, and Switzerland. For a handful of countries like Malaysia, Singapore, South Korea, and Spain, their equity markets fell to around the lowest levels of the past decade.
In terms of bounce backs, every country has rallied off of its lows, but Mexico is up the least at just 2.8%. So far the bounce backs hardly register on the long-term price charts for most countries, but there are some where the bounce has moved price back inside the long-term uptrend channel that had been in place prior to the crash. Norway, Russia, Sweden, Switzerland, and Taiwan are examples of countries where this is the case. Start a two-week free trial to Bespoke Institutional to access our Global Macro Dashboard and much more.
