Empire Fed Improved But Still Very Weak
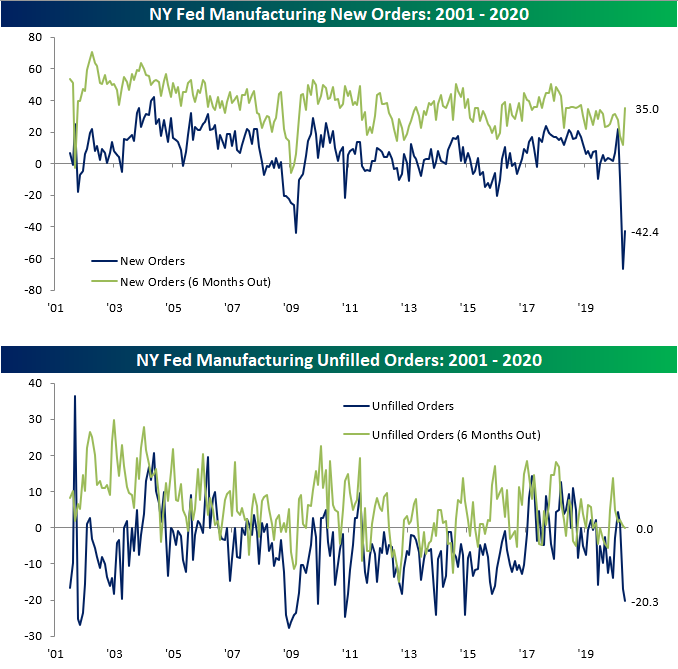
Last month, the New York Federal Reserve’s manufacturing index plummeted to a record low level of -78.2 on broad weakness across its categories. One month later, the index has improved rising to -48.5 but is still pointing to an extremely weak level of activity in the New York region.

To put into context just how far the index has fallen and how weak conditions are, this month’s 29.7 increase was the second largest month-over-month increase on record (the largest was a 30.2 point jump in May of 2003), and that still leaves the index at a lower level than every month in the history of the data outside April. Similarly, the index for Shipments, Number of Employees, and Average Workweek all remain at very low levels even though they rose by the most in a single month on record. Overall, activity remains very weak though not to the same extent as last month.

Looking at demand, the indices for New Orders and Unfilled Orders moved in opposite directions in May. While New Orders recovered a bit, rising to -42.4, the index for Unfilled Orders fell further down to -20.3. The respective indices for expectations six months out for these categories saw the same type of movement. For New Orders, the 23.9 point increase was the fourth-largest since the data begins in 2001, but like the headline number, that massive improvement still leaves it at one of the lowest levels in history. Meanwhile, the index for unfilled orders fell to -20.3 which is its lowest level since December of 2014.
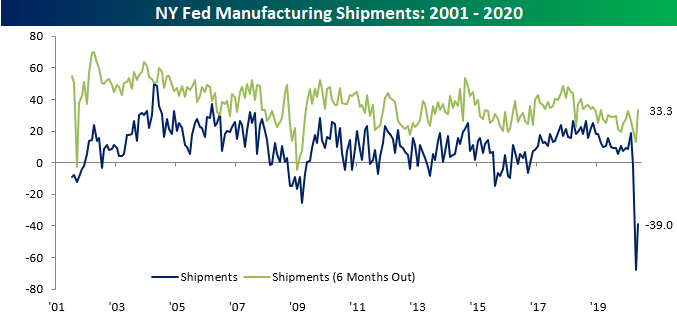
As for shipments, the 29.1 point increase in May was the largest one month jump on record. But again, the actual level of the index is the second-lowest ever. In other words, demand has continued to deteriorate significantly though perhaps not at the same rate as was observed in April.
As for the indices covering employment, there was also a substantial pickup in May with the indices for Number of Employees and Average Workweek rising by the largest amount of any month in the history of the data. Unlike some of the other categories, this increase brings Number of Employees back to the low end of the post-financial crisis range rather than a near-record low. So while there were still fewer employees with shorter workweeks, the readings moderated a bit from April. Start a two-week free trial to Bespoke Institutional to access our interactive economic indicators monitor and much more.

The Return to the Road
Thursday afternoon, Elon Musk tweeted the chart below showing usage (as a percentage of maximum) of Tesla charging stations by global region on a rolling 7-day basis. While the APAC region broadly has not skipped a beat during the COVID-19 pandemic, North America, as well as the EMEA region (Europe, Africa, and the Middle East), saw usage crater in the past few months as stay at home orders were observed and fewer people traveled. But things look to have bottomed out in April as the economy shows hints of reopening and people take to the roads.
At the lows, these two regions saw charge station usage fall to the high 20%/low 30% range just like China did earlier this year. Focusing on China, once the lockdowns were lifted, usage saw a one-way street higher as it climbed back up to more normal levels. If North America and EMEA follow similar patterns, within a month they too should be back up to their prior ranges.

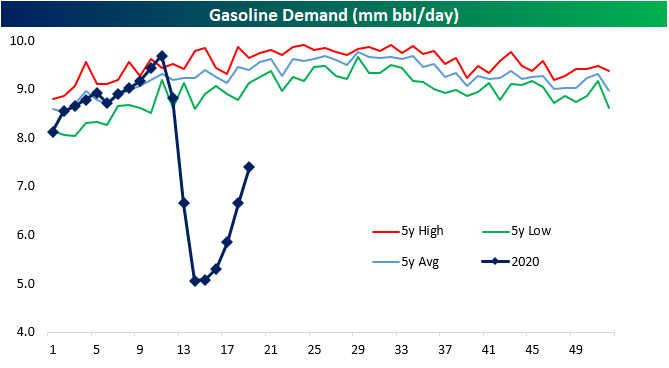
Although the electric car market is a fraction of the size of combustion engine cars, gasoline-powered cars have been showing a similar trend as could be inferred from recent petroleum-based data. The chart below shows gasoline demand from the EIA’s Weekly Petroleum Status Report. Although demand for the fuel that powers the bulk of the world’s vehicles remains at historically low levels, it too has begun to pick up in recent weeks after bottoming in the first week of April. This week actually marked the fifth straight week with an increase in demand. Again that is likely in part thanks to the economy reopening but seasonality is also another factor. As seen in the chart below, the summer months typically see the highest demand for the year. Overall, while demand is still far from normal levels, the combined pickup, as well as charger usage, seems to point that drivers in the US and around the globe are at least partially taking to the roads again whether that be in the form of the daily commute or summer getaway. Start a two-week free trial to Bespoke Institutional to access our interactive economic indicators monitor and much more.
Sentiment Unexpectedly Improves
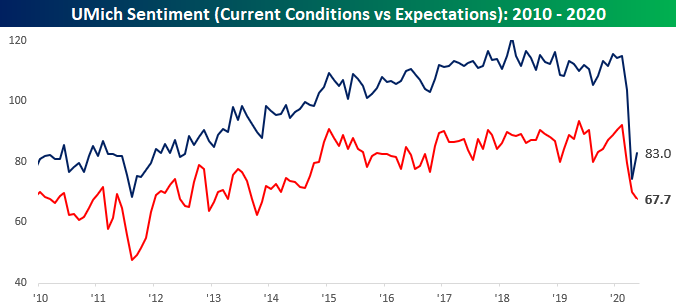
The preliminary read on sentiment from the University of Michigan was a surprising bright spot in Friday’s weak economic data as the headline reading improved from 71.8 up to 73.7 versus expectations for a decline to 68.0. Even with this increase, sentiment remains near a 10-year low, so it’s not as though investors are actually positive, they’re just less negative. While the increase in sentiment was a bit of a surprise, it makes sense. April was a month where the economy was essentially shut down, so the impact of that sudden stop on sentiment was intense. However, now that things have started to thaw a little bit, you can’t fault people for becoming more optimistic.

While consumers are feeling a bit better about the way things are, they are still extremely uneasy about the future. The chart below breaks down sentiment towards current conditions and expectations about the future. While the current conditions component showed some improvement, the expectations component saw further declines.
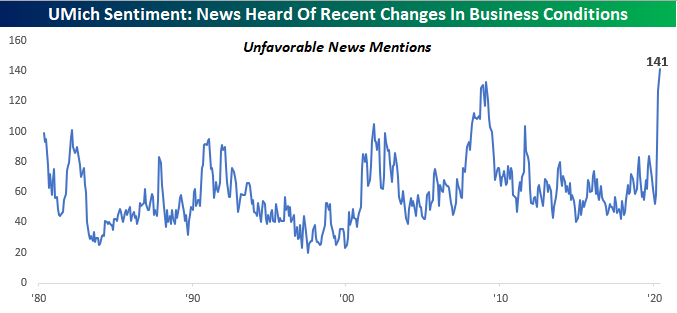
One question in the monthly survey that caused us to do a double-take was the question that asks, “During the last few months, have you heard of any favorable or unfavorable changes in business conditions? And what did you hear?” In this month’s survey, the index that tracks instances of unfavorable news mentions hit a record high of 141. This series goes all the way back to 1959, and never before has it been near current levels. The prior high for this index was back in the depths of the financial crisis when the index peaked at 133. There hasn’t been much good news lately, but even this reading is extreme. Start a two-week free trial to Bespoke Institutional for full access to our research and interactive tools.
Retail Sales – R.I.P.
We were expecting the worst monthly report on record in today’s Retail Sales report for April, and the bar wasn’t set nearly low enough. While economists were forecasting a 12.% m/m decline in sales, the actual decline was much larger at 16.4%. Ex Autos and Ex Autos and Gas, the declines were even weaker. Not bad enough for you yet? Well, March’s report was also revised lower. To put the last two months in perspective, total retail sales have declined by more than 23%. That’s nearly a quarter of total sales!
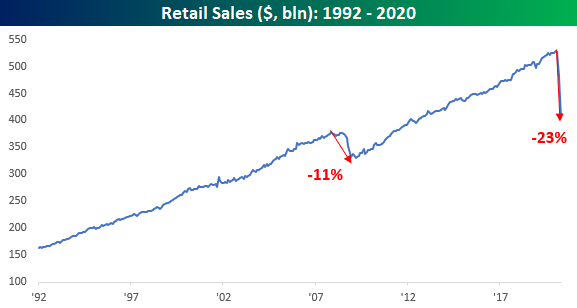
Among individual sectors, the sharpest decline in sales has come from the Clothing sector. From its recent peak, the monthly rate of sales in this sector has declined by nearly 90%. Apparently, we’re becoming a nation of nudists!

For anyone with more than a passing interest in how the economic shutdown is impacting economic data, our monthly update on retail sales is a must-read. To see the report, sign up for a monthly Bespoke Premium membership now!
Breadth Picking Up But Still Low
With the S&P 500 range bound over the past couple of weeks, short term breadth has left something to be desired. So far in May less than half of trading days have seen a positive net number of advancing stocks in the S&P 500 . As such, and as we noted earlier this week, the 10-day advance/decline lines across sectors had broadly entered oversold territory this week. Some of the more beaten down sectors like Consumer Discretionary and Financials did so to a more extreme degree than other sectors. But yesterday’s intraday reversal higher marked the first day this week with positive breadth for the index which allowed the 10-day A/D lines of Communication Services, Energy, Utilities and the S&P 500 to exit oversold territory. Meanwhile breadth for Consumer Discretionary, Financials, Industrials, Materials, and Real Estate all remain pretty weak. Start a two-week free trial to Bespoke Institutional to access our Daily Sector Snapshot and much more.

Ugliest Economic Data Day of All Time?
It has been a pretty quiet week of economic data so far, but the week closes out on a busy and what will ultimately be an ugly note. Reports on the calendar for tomorrow include Retail Sales, Industrial Production, and Capacity Utilization, which all cover the month of April. In addition to those reports, data for May includes Empire Manufacturing and preliminary Michigan Confidence. April was the peak period of the economic shutdowns, and the data will highlight that. Retail sales is expected to show its largest m/m declines on record (dating back to 1990), building on already weak readings from March. The history for Industrial Production goes all the way back to 1920, and even with 100 years of data (including the Great Depression), there has never been another month where it saw a larger m/m decline at least based on current estimates. Likewise, data for Capacity Utilization goes back to WWII, and that too will likely be the weakest on record. With all the weak hard data, it’s somewhat surprising to see that Michigan Confidence is only expected to fall to its lowest level since 2011. In any other time, a nine-year low reading in an economic indicator would be notable enough, but in the midst of a global pandemic, it’s peanuts. Start a free trial to Bespoke’s premium platform for full access to our stock market analysis and interactive tools.
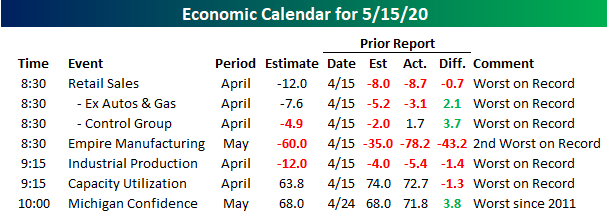
Chart of the Day: Capex Cutbacks
Investors Remain On Guard
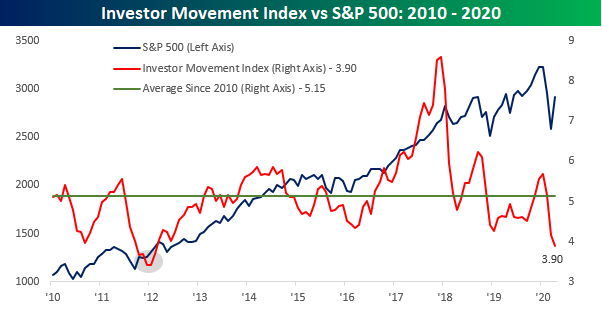
In a post earlier today, we noted that individual investors still remain overwhelmingly bearish despite the equity market’s rally off the March lows. Another sentiment indicator released by TD Ameritrade supports this view that investors aren’t particularly bullish right now. The TD Ameritrade Investor Movement Index is a proprietary, behavior-based index created by TD Ameritrade designed to indicate the sentiment of individual investors’ portfolios. It measures what investors are actually doing, and how they are actually positioned in the markets.
The TD Ameritrade Investor Movement Index has been in existence since 2010, and in that entire history there have only been five months where the index was weaker than it is now, and that was from October 2011 through February 2012. That was also a period that marked a major low in the equity market and was followed by a nearly uninterrupted three-year rally in the S&P 500.
While the Investor Movement Index is near record lows right now, it has been weak for some time, and that weakness came even as the S&P 500 was climbing to record highs over the last 12-18 months. In other words, while investors are just about as cautious as they have been at any time in the last ten years, this conservatism is nothing new. Start a two-week free trial to Bespoke Institutional for full access to our analysis and interactive tools.
Sentiment Still Sits Bearish
In last Thursday’s Chart of the Day, we noted that for the first time in a decade less than a quarter of respondents were bullish or neutral while over half were bearish. Although that isn’t exactly the case again this week, sentiment still leans heavily bearish. Bullish sentiment dropped down further to 23.31% from 23.67% last week. That is the lowest level of bullish sentiment since the COVID-19 pandemic began and the lowest number since last October when the percentage of investors reporting as bullish bottomed out at 20.31%.

The move out of the bullish camp didn’t exactly flow into the bearish camp, though. Bearish sentiment likewise fell slightly this week from 52.66% to 50.61%. Although that is slightly lower, the majority of those surveyed are still bearish.

Simply put, bearish sentiment has been high for a long time. Of the previously mentioned past ten weeks, even if bearish sentiment was not above 50% it was at least one standard deviation above its historical average. That now ranks as the longest streak since 2008 (14 weeks) and the fourth-longest in the history of the survey daying back to 1987.

With such a large divergence between bulls and bears, the bull-bear spread now stands at -27.3 which is slightly better than the -28.99 reading last week but still clearly at the low end of the past decade’s readings. Start a two-week free trial to Bespoke Institutional to access our interactive economic indicators monitor and much more.

Sixth Straight Decline In Claims
This week was another ugly one for jobless claims, although the weekly trend is moving in the right direction. While the 2.981 million print was significantly higher than estimates of 2.5 million, this week marked the sixth in a row that claims were down week-over-week. This week also marked the first sub-3 million print and the lowest number since claims first spiked in the week ending March 20th. While the slowed pace of claims is an improvement, this was a smaller WoW decline compared to the past several weeks. Additionally, with another 2.981 million added this week, the grand total of jobless claims since that March 20th print now sits at nearly 36.5 million, or roughly 11% of the entire US population.

As shown in the chart below, the streak of WoW declines over the past six weeks is now tied for the second longest such streak on record. Back in 2016, 2009, 1994, and 1993 were the last times that claims had fallen for six straight weeks, and there have only been two other periods where claims fell for longer: 2013 and another in 1980. Both of those streaks ended at seven weeks.

As for non-seasonally adjusted claims the same story holds true. The drop to 2.614 million this week was the fifth consecutive weekly decline and the lowest print since the initial spike in claims in late March.

With another lower print, the four-week moving average has also continued to decline. That measure has now declined for three straight weeks to its current level of 3.617 million. Start a two-week free trial to Bespoke Institutional to access our interactive economic indicators monitor and much more.
