
See what’s driving market performance around the world in today’s Morning Lineup. Bespoke’s Morning Lineup is the best way to start your trading day. Read it now by starting a two-week trial to Bespoke Premium. CLICK HERE to learn more and start your trial.
“Charity is injurious unless it helps the recipient to become independent of it.” – John D. Rockefeller
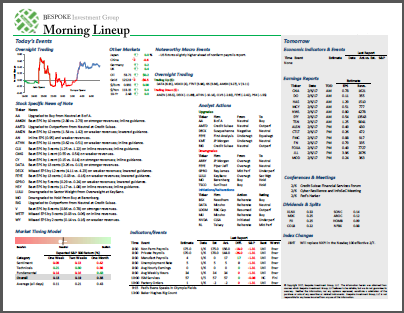
Below is a snippet of commentary from today’s Morning Lineup. Start a two-week trial to Bespoke Premium to view the full report.
After a negative start to the week, futures are staging a modest turnaround Tuesday, with the S&P 500 indicated to open up 0.19% while the Nasdaq is up 0.35%. Treasuries are offering modest relief, with the 10-year yield down 3 bps to 5.21%, while oil is down 1.5% as investors hold out hope for a deal in the Middle East. Even without one, though, the WSJ reports this morning that Iran’s power to control the Strait of Hormuz has been breaking down.
Asian stocks were weaker again overnight, although no major benchmark was down more than half a percent as rising oil prices and interest rates during yesterday’s US session weighed on sentiment. The only economic report on the calendar was Leading Indicators in Japan for July, which increased less than expected (1.5% vs 1.7%).
European stocks are going the other way in early trading, but like Asia, the moves have been modest with the exception of Italy and Spain, which are both up over 0.5%. Consumer Confidence in the EU was right in line with expectations, while Spanish CPI rose more than expected (+4.9% y/y bs +4.6% y/y).
The pace of economic activity picks up steam this morning with the FHFA House Price Index and Case-Shiller Housing data at 9 AM, followed by Consumer Confidence and the August JOLTS report at 10.
If you’re looking at the performance of US indices over the last week, it has been entirely correlated to market cap. The Nasdaq 100 ETF (QQQ) has seen the smallest decline, falling just 0.65%, while the S&P 500 (SPY) is down just over 1%. On the next rung down the ladder, midcaps (MDY) are down 1.08%, while the small-cap Russell 2000 (IWM) is way down on the bottom rung with a decline of nearly 2%. Relative to each ETF’s trading range, QQQ is overbought, SPY is in neutral territory, MDY is oversold, and IWM is at extreme oversold levels. Perfect symmetry!

While the S&P 500 is down barely more than 1%, five sector ETFs are down over 2.5%. Leading the way lower, Utilities (XLU) is down 3.5% while Communication Services (XLC) and Financials (XLF) are also down more than 3% each. On the positive side, Health Care (XLV) and Consumer Staples (XLP) are the only sectors in the black, while Technology (XLK) is barely lower. Relative to each sector’s trading range, the S&P 500 is still in neutral territory, but seven sectors are oversold, including three that are at extreme oversold levels. Technology is the only sector at overbought levels, while Health Care (XLV) and Energy (XLE) are the only other sectors above their 50-day moving averages.

Finally, the chart below shows where the S&P 500 and each sector ETF is trading relative to its 52-week high. Although the S&P 500 is down less than 2%, every sector is down at least 2%, four are down over 10%, and the average is down 8.7%. Utilities, generally considered the most conservative sector of the 11, are down close to 18%, as long-term Treasuries, another traditional “widows and orphans” asset class, have seen steep losses due to higher rates.

Start a two-week trial to Bespoke Premium to continue reading today’s full Morning Lineup.
