
See what’s driving market performance around the world in today’s Morning Lineup. Bespoke’s Morning Lineup is the best way to start your trading day. Read it now by starting a two-week trial to Bespoke Premium. CLICK HERE to learn more and start your trial.
“At night a candle’s brighter than the sun” – Sting
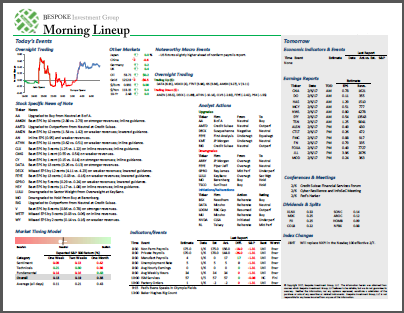
Below is a snippet of commentary from today’s Morning Lineup. Start a two-week trial to Bespoke Premium to view the full report.
Futures are higher to close out the week, but barring further gains in the regular session, it won’t be enough to put the S&P 500 into positive territory for the week. S&P 500 futures are up 0.5% while the Nasdaq is up slightly more at 0.6%. The catalyst for the gains this morning is lower oil prices and lower yields. Oil is lower on a report that France and other European countries are planning to release some of their diesel reserves to help lower prices. Gold is also fractionally higher while Bitcoin is up over 2%.
Asian stocks closed out the week mostly lower. The Nikkei fell close to 1% while the Hang Seng plunged more than 2.6%. South Korea bucked the trend by rising a modest 0.5%. A higher-than-expected CPI and Unemployment Rate in Japan helped contribute to the declines, while a weaker-than-expected CPI in South Korea supported the gains in the Kospi.
Unlike Asia, European stocks are closing out the week with gains. The STOXX 600 is up over 1%, led higher by Germany, while Italy lags. The gains come despite a slightly higher-than-expected Eurozone headline CPI for September, which came in at 3.8% y/y versus forecasts for an increase of 3.7%.
The main economic report on the calendar today is the September Nonfarm Payrolls at 8:30 AM, but after that, we’ll close out the week with Factory Orders and Durable Goods at 10 AM and then the Baker Hughes Rig Count at 1 PM.
Weak breadth was the story of Q3 and especially September. In the 21 trading days last month, there were just seven days with positive breadth, and the cumulative advance/decline line for the month was -1,560, which ranks as the 13th weakest monthly breadth reading since 1990. Comparing the cumulative A/D line to the index’s price level shows an ever-widening divergence as the market has become increasingly narrow. For the year, the cumulative A/D line is still positive, but after peaking just above 3,000 in mid-August, it’s now under 1,000.

As mentioned, September’s cumulative A/D line was the 13th weakest since 1990, and the chart below compares the S&P 500’s performance last month to its performance in the 24 other months comprising the 25 worst breadth months since 1990. Including last month, the S&P 500’s average performance during these 25 months was a decline of 6.7%, or more than six full percentage points more than last month’s 0.45% decline. Last month was also the only month of that group where the S&P 500 declined less than 2%.

The scatter chart below shows the breadth versus price decline from a different perspective, but here again, you can see what an outlier last month was as no other month had anywhere near as modest a decline. So, does this mean that the index is due to catch up with the weak breadth? While there’s no other month we can point to where there was as wide a divergence between price and breadth, what we can say is that of the 10 other months among the weakest 25 months for breadth where the S&P 500 declined less than 5%, the S&P 500’s median performance in the month after was a gain of 2.8% with positive returns nine out of 10 times.

Start a two-week trial to Bespoke Premium to continue reading today’s full Morning Lineup.
