Chart of the Day: Stocks Shrug Off Terminal Rate Surge
Claims Still Below 200K
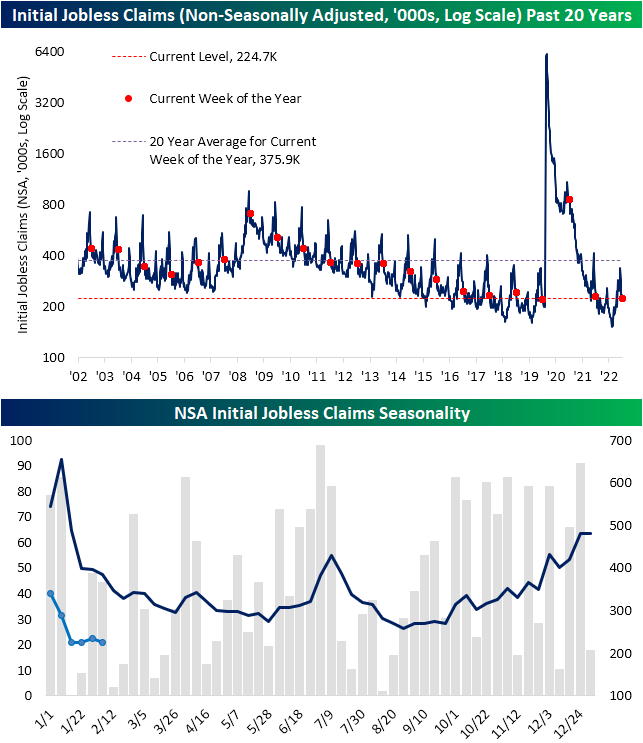
Jobless claims continue to impress in the new year. For the fifth week in a row, seasonally adjusted initial claims have come in with a sub-200K reading. That is the longest streak since a 10 week long stretch ending in April of last year. Although claims have remained at a healthy level, there hasn’t been much in the way of improvement over the last few weeks with claims yet to move below the 183K low at the end of January.

On a non-seasonally adjusted basis, the first few months of the year tends to see a sharp unwind in claims, albeit with some moderation during the current week of the year which is being observed currently with fairly flat readings in claims over the past few weeks. At current levels, this year’s reading was roughly in line with the comparable week of the past several years with the exception of the much more elevated reading in 2021.
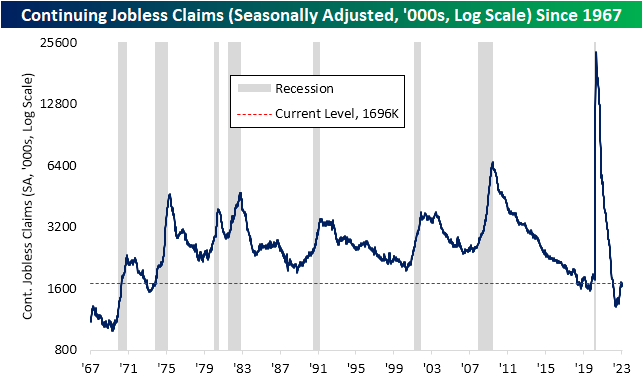
While not to say the reading is at unhealthy levels, continuing claims have not been as strong as initial claims. Claims have risen in each of the past two weeks, totaling 1.696 million in the most recent print. That is the highest level since the week of December 24th. Overall, both initial and continuing claims continue to show healthy readings without much in the way of rapid improvement or deterioration. Click here to learn more about Bespoke’s premium stock market research service.
The Bespoke 50 Growth Stocks — 2/16/23
The “Bespoke 50” is a basket of noteworthy growth stocks in the Russell 3,000. To make the list, a stock must have strong earnings growth prospects along with an attractive price chart based on Bespoke’s analysis. The Bespoke 50 is updated weekly on Thursday unless otherwise noted. There were no changes to the list this week.
The Bespoke 50 is available with a Bespoke Premium subscription or a Bespoke Institutional subscription. You can learn more about our subscription offerings at our Membership Options page, or simply start a two-week trial at our sign-up page.

The Bespoke 50 performance chart shown does not represent actual investment results. The Bespoke 50 is updated weekly on Thursday. Performance is based on equally weighting each of the 50 stocks (2% each) and is calculated using each stock’s opening price as of Friday morning each week. Entry prices and exit prices used for stocks that are added or removed from the Bespoke 50 are based on Friday’s opening price. Any potential commissions, brokerage fees, or dividends are not included in the Bespoke 50 performance calculation, but the performance shown is net of a hypothetical annual advisory fee of 0.85%. Performance tracking for the Bespoke 50 and the Russell 3,000 total return index begins on March 5th, 2012 when the Bespoke 50 was first published. Past performance is not a guarantee of future results. The Bespoke 50 is meant to be an idea generator for investors and not a recommendation to buy or sell any specific securities. It is not personalized advice because it in no way takes into account an investor’s individual needs. As always, investors should conduct their own research when buying or selling individual securities. Click here to read our full disclosure on hypothetical performance tracking. Bespoke representatives or wealth management clients may have positions in securities discussed or mentioned in its published content.
Bespoke’s Morning Lineup – 2/16/23 – More Data
See what’s driving market performance around the world in today’s Morning Lineup. Bespoke’s Morning Lineup is the best way to start your trading day. Read it now by starting a two-week trial to Bespoke Premium. CLICK HERE to learn more and start your trial.
“Like it or not, life is a game. Whoever denies that truth, whoever simply refuses to play, gets left on the sidelines.” – Phil Knight

Below is a snippet of content from today’s Morning Lineup for Bespoke Premium members. Start a two-week trial to Bespoke Premium now to access the full report.
There’s a tone of weakness in the market this morning ahead of another busy morning for economic data with PPI, Housing Starts, Building Permits, Jobless Claims, and the Philly Fed all being released at 8:30. The S&P 500 is poised to open down about 40 basis points (bps) while the Nasdaq is down closer to 0.5%. Despite the weakness in equities, Treasuries are actually trading modestly higher as crude sees modest gains. The only real asset class showing strength is crypto as bitcoin is up nearly 2%.
Overshadowed somewhat by the much stronger-than-expected Retail Sales report, yesterday’s update on Industrial Production for January missed forecasts by a wide margin showing no growth in January versus forecasts for an increase of 0.5%. January’s report marked the second straight month that Industrial Production was 1.5% or more below a 12-month high which is the largest decline from a peak since the COVID crash. Looking at the chart below, there have been plenty of other times when Industrial Production showed larger declines. That being said, in the majority of instances where Industrial Production dropped this much or more, a recession wasn’t far behind. There were exceptions but not a lot of them.
This doesn’t mean that a recession is imminent. Every period is different. What the current period has going for it is that consumer balance sheets were in great shape heading into the current FOMC tightening cycle, and the employment backdrop remains positive. The hope is that these factors will provide a long enough bridge to get over the valley of the manufacturing sector’s slowdown.

Our Morning Lineup keeps readers on top of earnings data, economic news, global headlines, and market internals. We’re biased (of course!), but we think it’s the best and most helpful pre-market report in existence!
Start a two-week trial to Bespoke Premium to read today’s full Morning Lineup.
The Closer – Deficits Wider, Seasonality Slip-Ups, EIA Mystery – 2/15/23
Log-in here if you’re a member with access to the Closer.
Looking for deeper insight into markets? In tonight’s Closer sent to Bespoke Institutional clients, we start out with a look at the CBO’s update of fiscal policy forecasts (page 1) followed by a rundown of tonight’s earning reports (pages 2 and 3). We then dive into apparent seasonal adjustment issues in the retail sales report (page 4) before turning to the latest hard manufacturing data (page 5). After a recap of today’s 20 year bond auction (page 6) we dive into some of the oddities of the latest EIA data (pages 7 and 8). We finish with a look at homebuilder stocks after big jumps in homebuilder sentiment as we saw today (page 9).

See today’s full post-market Closer and everything else Bespoke publishes by starting a 14-day trial to Bespoke Institutional today!
Daily Sector Snapshot — 2/15/23
Bespoke Baskets Update — February 2023
Fixed Income Weekly: 2/15/23
Searching for ways to better understand the fixed income space or looking for actionable ideas in this asset class? Bespoke’s Fixed Income Weekly provides an update on rates and credit every Wednesday. We start off with a fresh piece of analysis driven by what’s in the headlines or driving the market in a given week. We then provide charts of how US Treasury futures and rates are trading, before moving on to a summary of recent fixed income ETF performance, short-term interest rates including money market funds, and a trade idea. We summarize changes and recent developments for a variety of yield curves (UST, bund, Eurodollar, US breakeven inflation and Bespoke’s Global Yield Curve) before finishing with a review of recent UST yield curve changes, spread changes for major credit products and international bonds, and 1 year return profiles for a cross section of the fixed income world.
In this week’s report, we review the movement in short-term interest rates over the past year.

Our Fixed Income Weekly helps investors stay on top of fixed-income markets and gain new perspectives on the developments in interest rates. You can sign up for a Bespoke research trial below to see this week’s report and everything else Bespoke publishes free for the next two weeks!
Click here and start a 14-day free trial to Bespoke Institutional to see our newest Fixed Income Weekly now!
Homebuilder Sentiment Pops
Wednesday’s release of homebuilder sentiment from the NAHB showed a significant rebound in sentiment as the headline reading has risen in back-to-back months from the low of 31 in December up to 42 this month. While that is not a screaming endorsement of strength from homebuilders (in the past decade, the only times the index was this low was the past few months and the start of the pandemic), it does mark an improvement in sentiment that is consistent with the recent turnaround in mortgage rates and the rise in weekly mortgage applications.

While sentiment has risen in back-to-back months, the moves from January to February were historic across the report. The only index to not experience a monthly move that ranks in the top decile of all periods was the Midwest. Future Sales was the most impressive with its 11-point jump tied with November 1988 for the second largest month-over-month increase on record.
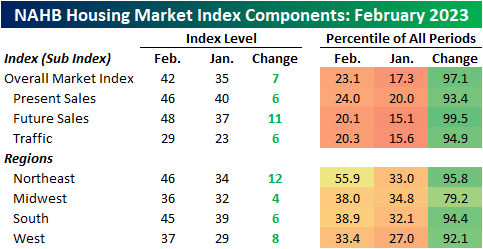
As for the headline index, the 7-point increase was the largest increase since the months of May, June and July 2020 when sentiment began to recover from the pandemic plummet. Prior to 2020, June 2013 was the last time sentiment has risen by as much. Click here to learn more about Bespoke’s premium stock market research service.
