May 19, 2016
We’ve just released our weekly Sector Snapshot report (see a sample here) for Bespoke Premium and Bespoke Institutional members. Please log-in here to view the report if you’re already a member. If you’re not yet a subscriber and would like to see the report, please start a 14-day trial to Bespoke Premium now.
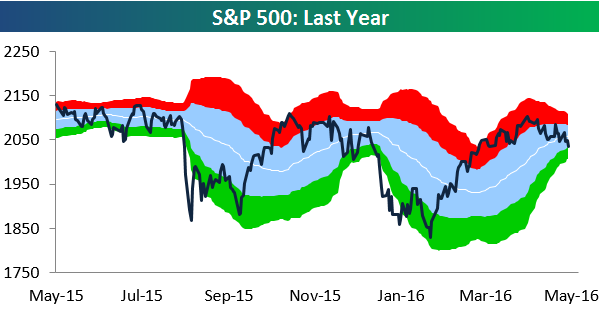
Below is our trading range chart for the S&P 500 that’s always included in the Sector Snapshot. The green area in the chart represents oversold territory for the index, and as you can see, we hit oversold levels today just barely for the first time since mid-February.
Below our chart of the S&P 500, we provide our trading range screen for the ten S&P 500 sectors. For each sector, the dot represents where it’s currently trading, while the tail end represents where it was trading one week ago. The black vertical “N” line represents each sector’s 50-day moving average. Last week at this time, two of ten sectors were overbought while just one was oversold. As of today, six sectors are oversold while none are overbought. Just three sectors remain above their 50-day moving averages — Energy, Financials, and Materials. These are the three sectors that had been performing the worst coming into 2016, and yet now they’re the sectors keeping the market afloat.
To see our full Sector Snapshot with additional commentary plus six pages of charts that include analysis of valuations, breadth, technicals, and relative strength, start a 14-day free trial to our Bespoke Premium package now. Here’s a breakdown of the products you’ll receive.
May 12, 2016
We’ve just released our weekly Sector Snapshot report (see a sample here) for Bespoke Premium and Bespoke Institutional members. Please log-in here to view the report if you’re already a member. If you’re not yet a subscriber and would like to see the report, please start a 14-day trial to Bespoke Premium now.
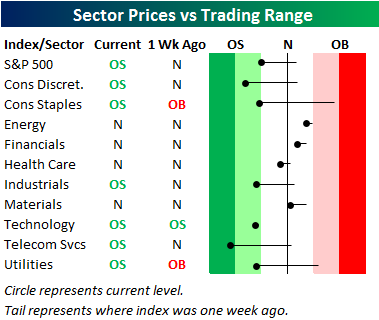
Below is our trading range screen for the ten S&P 500 sectors, which is always included in the weekly Sector Snapshot. The screen allows you to quickly see which sectors have upside or downside momentum, and which sectors may be too extended to the upside or downside. For each sector, the dot shows where it is currently trading within its range, while the tail end shows where it was trading one week ago. The black vertical “N” line represents each sector’s 50-day moving average, and moves into the red or green zone are considered overbought or oversold. The darker the shading, the more extreme the reading.
As shown, last week at this time, nine sectors were in neutral territory along with the S&P 500 as a whole, while one sector — Technology — was oversold. Most sectors have experienced very little movement within their ranges over the last week, but Telecom and Consumer Staples are two big standouts to the upside. Consumer Staples moved from neutral to overbought, while Telecom moved from just above oversold territory to above its 50-day moving average. Health Care is the only sector that has moved lower within its range.
To see our full Sector Snapshot with additional commentary plus six pages of charts that include analysis of valuations, breadth, technicals, and relative strength, start a 14-day free trial to our Bespoke Premium package now. Here’s a breakdown of the products you’ll receive.
May 5, 2016
We’ve just released our weekly Sector Snapshot report (see a sample here) for Bespoke Premium and Bespoke Institutional members. Please log-in here to view the report if you’re already a member. If you’re not yet a subscriber and would like to see the report, please start a 14-day trial to Bespoke Premium now.
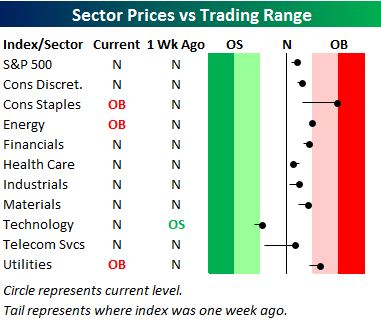
Below is our trading range screen for the ten S&P 500 sectors, which is always included in the weekly Sector Snapshot. The screen allows you to quickly see which sectors have upside or downside momentum, and which sectors may be too extended to the upside or downside. For each sector, the dot shows where it is currently trading within its range, while the tail end shows where it was trading one week ago. The black vertical “N” line represents each sector’s 50-day moving average, and moves into the red or green zone are considered overbought or oversold. The darker the shading, the more extreme the reading.
As shown, last week at this time there were five sectors in overbought territory and zero sectors in oversold territory. As of the close today, there are no longer any sectors in overbought territory and one sector — Technology — is oversold. We’ve clearly seen a slow drift lower for equities over the last couple weeks. As of now the trend can still be categorized as “mean reversion,” but if the S&P can’t hold its 50-day in the coming days, it will be a different story.
To see our full Sector Snapshot with additional commentary plus six pages of charts that include analysis of valuations, breadth, technicals, and relative strength, start a 14-day free trial to our Bespoke Premium package now. Here’s a breakdown of the products you’ll receive.
Apr 28, 2016
We’ve just released our weekly Sector Snapshot report (see a sample here) for Bespoke Premium and Bespoke Institutional members. Please log-in here to view the report if you’re already a member. If you’re not yet a subscriber and would like to see the report, please start a 14-day trial to Bespoke Premium now.
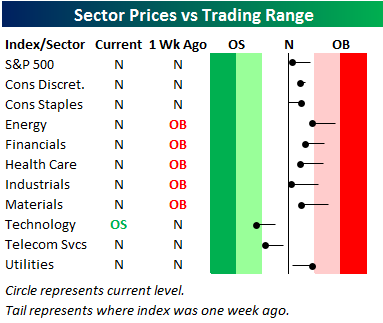
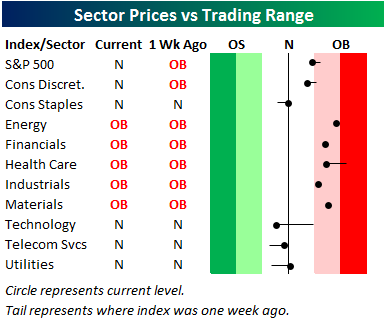
Below is our trading range screen for the ten S&P 500 sectors, which is always included in the weekly Sector Snapshot. The screen allows you to quickly see which sectors have upside or downside momentum, and which sectors may be too extended to the upside or downside. For each sector, the dot shows where it is currently trading within its range, while the tail end shows where it was trading one week ago. The black vertical “N” line represents each sector’s 50-day moving average, and moves into the red or green zone are considered overbought or oversold. The darker the shading, the more extreme the reading.
As shown, the S&P 500 has just moved below overbought territory, while five of ten sectors remain overbought. These include Energy, Financials, Health Care, Industrials, and Materials. No sectors are currently oversold, and five are in neutral territory. Notably, the Technology sector has seen pretty significant weakness within its range over the last week.
To see our full Sector Snapshot with additional commentary plus six pages of charts that include analysis of valuations, breadth, technicals, and relative strength, start a 14-day free trial to our Bespoke Premium package now. Here’s a breakdown of the products you’ll receive.
Apr 21, 2016
This content is for members only
Apr 14, 2016
This content is for members only